Report Highlights. The total student loan debt, currently $1.73 trillion, has risen every year with the exception of 2023.
- Federal student loan debt has grown at an annual average rate of 13.2% since 2007.
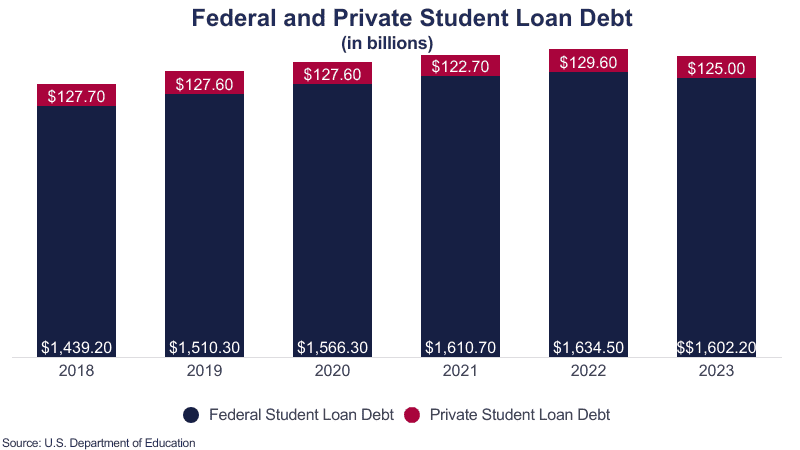
- Of the 1.73 trillion, federal loan debt accounts for 92.8% ($1.60 trillion) with private loan debt accounting for the remaining 7.2% ($125 billion).
- A total of 43.2 million Americans have federal loan debt.
Related reports include Average Student Loan Debt | Student Loan Debt by State | Average Student Loan Debt by Year | Student Loan Refinancing
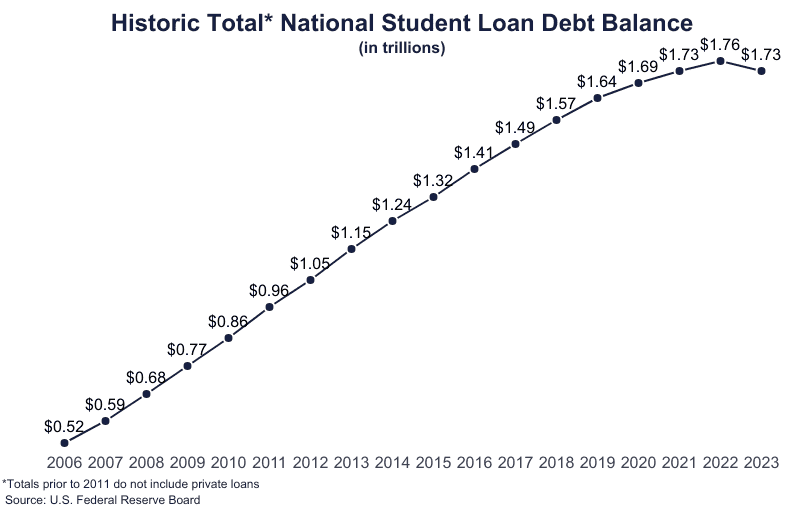
| Year | Total Debt | Year-over-Year Change |
|---|---|---|
| Year 2023 | Total Debt $1.73T | Year-over-Year Change -2.09% |
| Year 2022 | Total Debt $1.76T | Year-over-Year Change 1.77% |
| Year 2021 | Total Debt $1.73T | Year-over-Year Change 2.34% |
| Year 2020 | Total Debt $1.69T | Year-over-Year Change 3.42% |
| Year 2019 | Total Debt $1.64T | Year-over-Year Change 4.53% |
| Year 2018 | Total Debt $1.57T | Year-over-Year Change 5.24% |
| Year 2017 | Total Debt $1.49T | Year-over-Year Change 5.95% |
| Year 2016 | Total Debt $1.41T | Year-over-Year Change 6.44% |
| Year 2015 | Total Debt $1.32T | Year-over-Year Change 6.84% |
| Year 2014 | Total Debt $1.24T | Year-over-Year Change 7.87% |
| Year 2013 | Total Debt $1.15T | Year-over-Year Change 8.63% |
| Year 2012 | Total Debt $1.05T | Year-over-Year Change 9.87% |
| Year 2011 | Total Debt $960B | Year-over-Year Change 12.20% |
| Year 2010 | Total Debt $860B | Year-over-Year Change 10.86% |
| Year 2009 | Total Debt $770B | Year-over-Year Change 14.16% |
| Year 2008 | Total Debt $680B | Year-over-Year Change 14.67% |
| Year 2007 | Total Debt $590B | Year-over-Year Change 13.06% |
| Year 2006 | Total Debt $520B | Year-over-Year Change * |
Total Student Loan Debt
The total student loan debt balance was rising faster than the rate of tuition though its growth rate has slowed significantly in the past few years with a recent decrease. Since 2011, the yearly percent change has been steadily decreasing.
- The total student loan debt is about $1,727,200,000,000.
- Federal student loan debt totals $1,602,200,000,000.
- The nationwide total private student loan debt is estimated to be $125,000,000.
- Over the last 5 years, the total student loan debt balance has increased 10.2%, an annual rate of 2.0%.
- Over the last year, the total student loan debt balance has decreased 2.1%.
- The federal balance alone increased by 11.3%, an annual rate of 2.3%.
- Over the last year the federal balance also decreased 2.0%.
- During that time, the cost of college increased 14.1%, an annual growth rate of 2.81%.
- Also during that time, the value of the U.S. dollar increased by 22.0%, or an annual growth rate of 4.4%.
- Since 2007, the total federal student loan debt balance has increased 210.5%, averaging an annual growth rate of 13.2%.
- Total private loan debt increases at an annual rate of 4.4%.
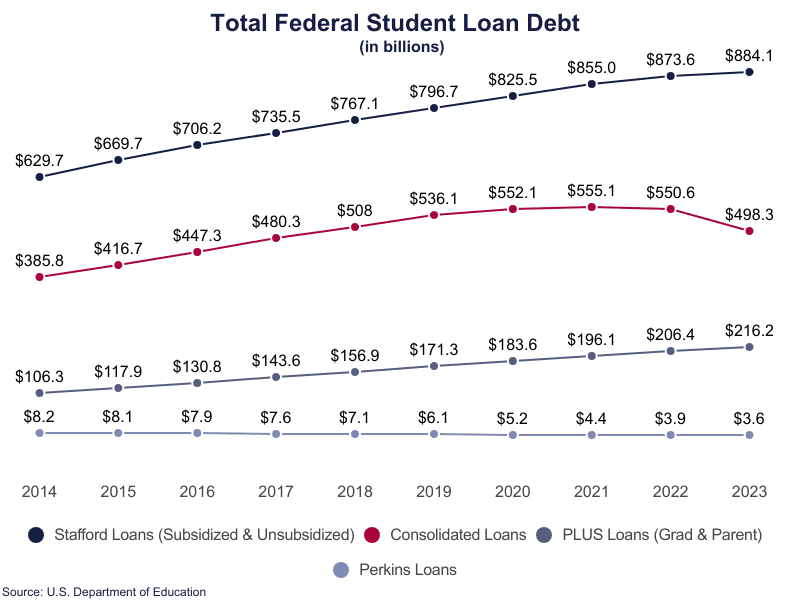
Federal Loan Debt Total Balance
Most of the total student loan debt balance is for federal loans, covering 92.8% of the total debt.
- $884.1 billion or 53.4% of federal loan debt is from Stafford loans.
- $498.3 billion or 33.7% of federal debt is from loans that have been consolidated (a process similar to refinancing but with no change‡ in interest rates).
- $281.5 billion in total federal student loan debt belongs to borrowers who owe between $20,000 and $40,000 (28.2% of borrowers).
- $281.7 billion in federal debt belongs to borrowers who owe $200,000 or more (2.9% of borrowers).
- Borrowers who owe between $5,000 and $10,000 account for a total of $55.9 billion or 3.4% of federal student loan debt.
‡The consolidated interest rate is the average of the existing loans’ interest rates rounded up to the nearest 1/8th%.
| Year | Undergraduate | Graduate¶ |
|---|---|---|
| Year 2023 | Undergraduate $884B | Graduate¶ $718B |
| Year 2022 | Undergraduate $873B | Graduate¶ $761B |
| Year 2021 | Undergraduate $855B | Graduate¶ $756B |
| Year 2020 | Undergraduate $826B | Graduate¶ $741B |
| Year 2019 | Undergraduate $797B | Graduate¶ $714B |
| Year 2018 | Undergraduate $767B | Graduate¶ $672B |
| Year 2017 | Undergraduate $723B | Graduate¶ $634B |
| Year 2016 | Undergraduate $704B | Graduate¶ $595B |
| Year 2015 | Undergraduate $667B | Graduate¶ $552B |
| Year 2014 | Undergraduate $632B | Graduate¶ $513B |
| Year 2013 | Undergraduate $584B | Graduate¶ $466B |
| Year 2012 | Undergraduate $539B | Graduate¶ $426B |
| Year 2011 | Undergraduate $488B | Graduate¶ $384B |
| Year 2010 | Undergraduate $426B | Graduate¶ $334B |
| Year 2009 | Undergraduate $376B | Graduate¶ $293B |
| Year 2008 | Undergraduate $335B | Graduate¶ $258B |
| Year 2007 | Undergraduate $298B | Graduate¶ $225B |
| Year 2006 | Undergraduate $270B | Graduate¶ $197B |
| Year 2005 | Undergraduate $241B | Graduate¶ $172B |
| Year 2004 | Undergraduate $222B | Graduate¶ $150B |
| Year 2003 | Undergraduate $198B | Graduate¶ $130B |
| Year 2002 | Undergraduate $179B | Graduate¶ $114B |
| Year 2001 | Undergraduate $161B | Graduate¶ $99B |
| Year 2000 | Undergraduate $144B | Graduate¶ $85B |
¶Data sources include consolidated loans among graduate debt.
Private Loan Debt Total Balance
Private loan debt is a small part of the total student loan debt balance, making up only 7.5% of the total amount. The latest statistics about private student loan debt are from the third fiscal quarter of 2023.
- In 2024, interest rates for private student loans can vary based on the lender but are typically from 4%-18%.
- 130.3 billion or 7.5% of the student debt was private in 2023.
- In 2023, 89.1% of the private loan outstanding balance, or $52.9 billion, was used to pay for an undergraduate degree.
- 10.9% of the private loans, or $14.2 billion, were used to pay for a graduate degree
- At this time, 74.3% of private loans were in repayment, totaling $96.8 billion.
- 18.0% of private loans were in deferment, and 1.4% were in forbearance, totaling $23.4 billion and $1.8 billion, respectively.
Analysis: Graduate Debt on the Rise?
While there has been a significant increase in graduate student borrowing, the raw data available does not itemize consolidated loans. In other words, it is not possible to tell if the loans consolidated were undergraduate or graduate loans. Further, all PLUS loans are considered graduate loan debt, though parents often take out PLUS loans to aid their undergraduate children. Therefore, there is likely a significant portion of graduate student loan debt that was actually used to undergraduate study.
- The current debt balance for federally consolidated loans is $498.3 billion or 31.1% of graduate debt.
- This is a 2% decrease in the consolidated debt balance from 2018.
- In comparison, there was an 11.3% increase in the total federal student loan debt.
- The current debt balance for Parent PLUS loans is $112.2 billion or 7.0% of the total debt.
- This is a 24.8% increase since 2018, averaging an annual growth rate of 5.0%.
- Graduate PLUS and Perkins loan debt totals $107.6 billion or 6.7% of federal debt designated as graduate student debt.
- This is a 45.2% increase since 2018 or an annual growth rate of 9.0%.