Inside This Week’s Bull Bear Report
- Is Risk-Off Positioning Signaling A Market Low
- How We Are Trading It
- Research Report – Inflation Is Subsiding Rapidly
- YouTube – Before The Bell
- Market Statistics
- Stock Screens
- Portfolio Trades This Week
Trump Reignites Fed Feud
Last week, we discussed the “tariff reprieve” that sent stocks ripping higher in the 3rd largest one-day advance on record.
“As we said last week, any good news would cause the market to rally sharply. On Wednesday, President Trump announced a 90-day pause on the full effect of new tariffs. Interestingly, the same headline sent stocks surging on Monday but was quickly deemed “fake news” by the White House. I suspect that Monday was a “leak” by the White House to test the market response, and President Trump kept that announcement handy to stave off a further decline in the markets. Whatever the reason, the markets needed the break.”
However, this week, the market was hit following a speech by Fed Chair Jerome Powell, in which he stated that the administration’s tariffs could spark “higher inflation and lower growth.” If that sounds familiar, it should. In 2021, Powell noted that inflation would be transitory as the money supply exploded by 42%. He was wrong then and is likely wrong again by fixating on hypothetical tariff shocks while ignoring the deflationary “red flags” from falling oil prices, slowing consumption, declining savings rates, and rising delinquencies.
Unsurprisingly, President Trump responded to Powell’s comments very quickly, reminiscent of the feud between the two during 2018. In a post on Truth Social, President Trump wrote:
Trump is correct in his statement. The ECB’s decision to cut rates for the seventh time was unanimous. Regardless of Powell’s reason for his position, the stress on the financial system is increasing. As we noted last week, credit spreads are rising, and there is clear evidence that the economy is weakening as consumer demand softens. The Federal Reserve remains overly concerned about missing the inflation push in 2021 by not recognizing the impact of shuttering economic production and sending checks to households. As such, the Fed will likely be late once again in identifying the deflationary pressure of tariffs on economic growth. Of course, just as in 2018, the Fed began cutting rates quickly during 2019 to stem the “repo crisis”. The Fed may be wrong again.
Technical Update
While the markets await the next Federal Reserve meeting, the uncertainty over monetary policy weighs on markets as much as the uncertainty about tariffs. This past week, the market reversed some of its gains from the massive “tariff reprieve” surge. With the MACD back on a buy signal and money flows turning positive, buyers are tepidly stepping back into the market. The 20-DMA continues to act as overhead resistance, defining the current downtrend. While there is undoubtedly a risk of another test of recent lows, which should be expected and why caution remains advisable, a break above the 20-DMA would lead to a rally to the 50-DMA. (Monday’s article will address the “Death Cross” and what it means for investors.)
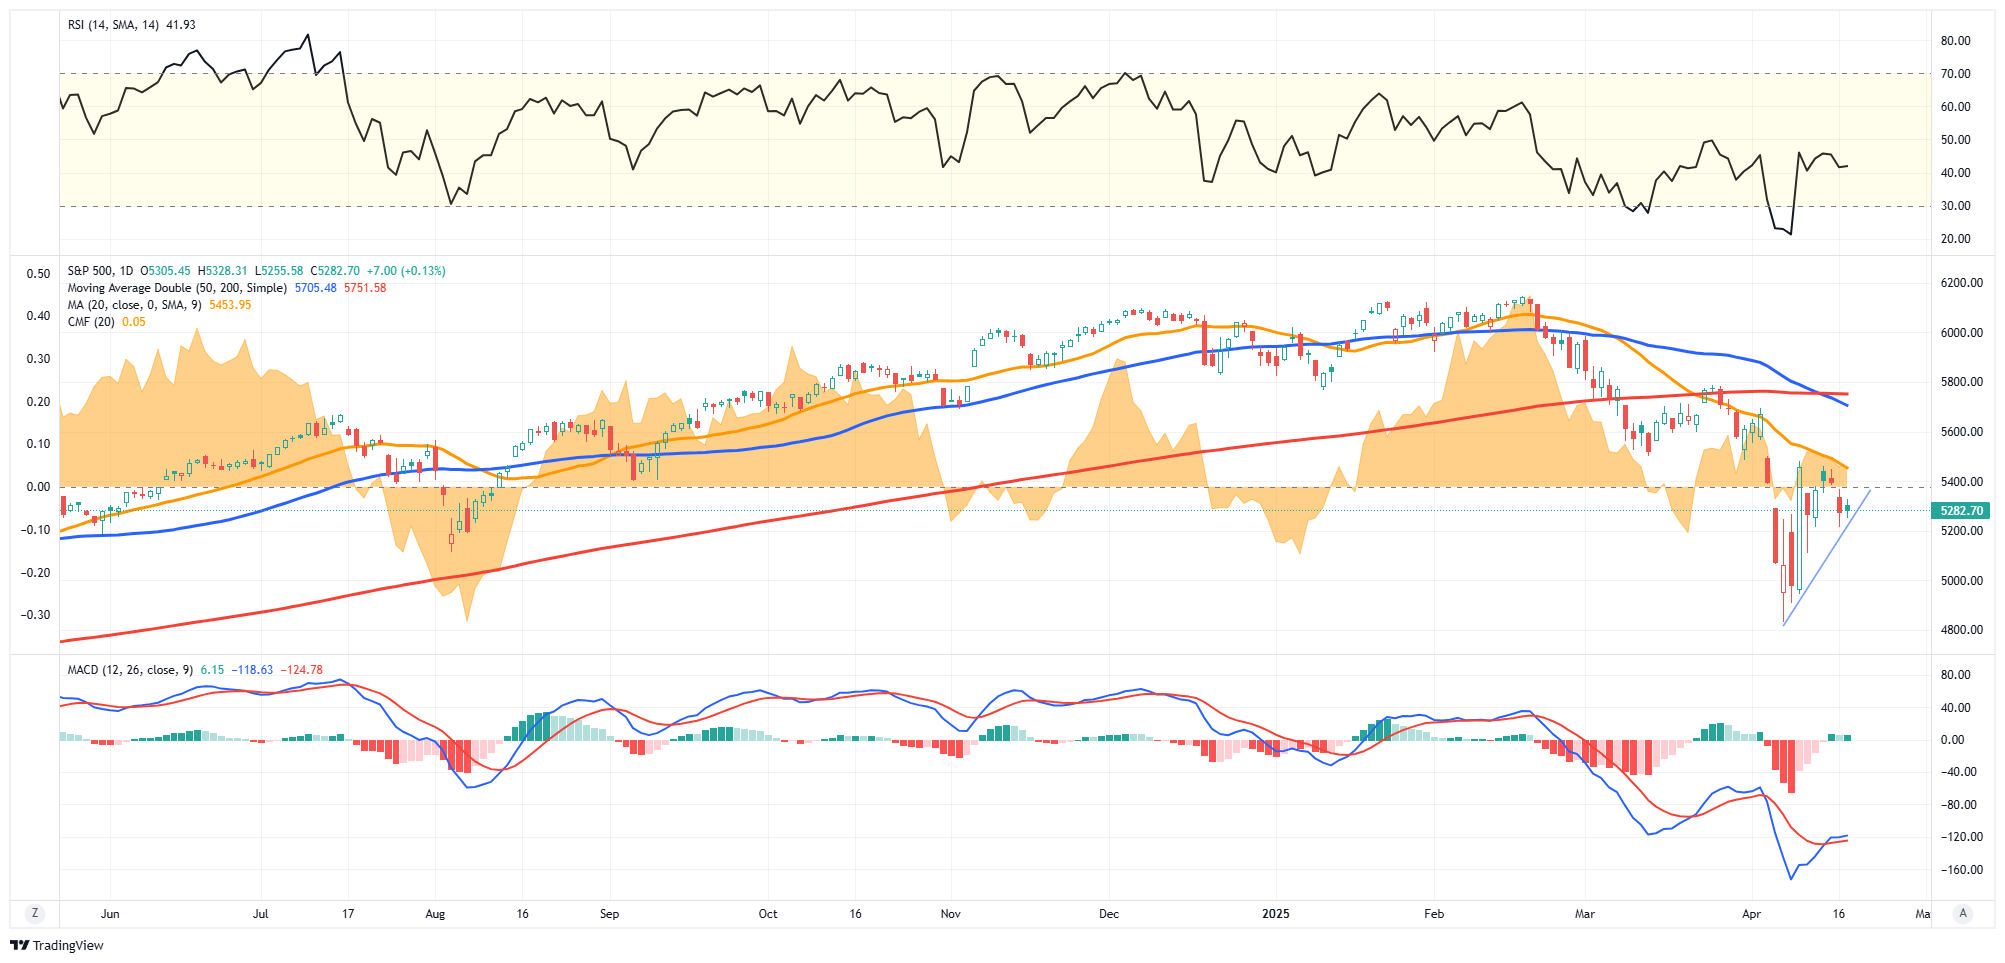
As is always the case, the market prices in current events and looks forward with more optimistic expectations. While there are many media headline-driven narratives, the tariffs are now a well-known factor, and markets have priced most of the impact into current prices and valuations. Furthermore, the bond market appears to have started resolving the recent “basis trade” blow-up, with bond yields and volatility declining.
Does that mean that the market is now devoid of risk? No. But, as we will discuss further in today’s commentary, we may be closing in on a near-term market low.
Let’s focus on a primary question: Is the market close to a bottom?
Need Help With Your Investing Strategy?
Are you looking for complete financial, insurance, and estate planning? Need a risk-managed portfolio management strategy to grow and protect your savings? Whatever your needs are, we are here to help.

The Art Of Contrarianism
You have likely heard the media stat that “bears are like a ‘broken clock,’ they are right twice a day.” While it may seem true during a rising bull market, the statement exposes the ignorance of those making such a claim. If you invert the logic, such things become more evident.
“If ‘bears’ are right twice a day, then ‘bulls’ must be wrong twice a day.”
The biggest problem for investors, and the “broken clock syndrome,” is the emotional biases of being either “bullish” or “bearish.” Effectively, when individuals pick a side, they become oblivious to the risks. One of the most significant factors is “confirmation bias,” where individuals seek confirmation and ignore non-confirming data.
As investors, we should be open to all the data, weigh incoming data accordingly, and assess the risk inherent in our portfolios. That risk assessment should be an open analysis of our current positioning relative to the market environment. Being underweight equities in a rising bull market can be as harmful as being overweight in a bear market.
We believe you should not be “bullish” or “bearish.” While being “right” during the first half of the cycle is essential, it is far more critical not to be “wrong” during the second half.
Howard Marks once stated that being a “contrarian” is tough, lonely, and generally right. To wit:
“Resisting – and thereby achieving success as a contrarian – isn’t easy. Things combine to make it difficult; including natural herd tendencies and the pain imposed by being out of step, particularly when momentum invariably makes pro-cyclical actions look correct for a while. (That’s why it’s essential to remember that ‘being too far ahead of your time is indistinguishable from being wrong.’)
Given the uncertain nature of the future, and thus the difficulty of being confident your position is the right one – especially as price moves against you – it’s challenging to be a lonely contrarian.”
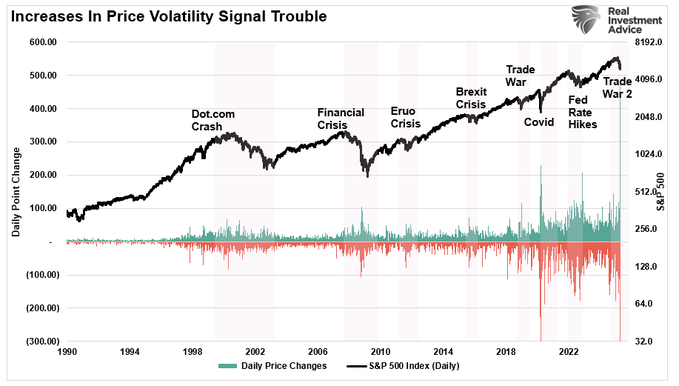
Emotions and volatility make us want to avoid the risk of loss. The increased price volatility and subsequent price decline created a substantially higher level of instability. That instability creates “fear” and drives investors to the behavioral bias of “loss aversion,” ultimately leading to poor outcomes.
The fundamentally bearish arguments of valuations, earnings, a Fed policy mistake, and a recession are certainly viable outcomes. However, if “everyone” already expects those outcomes, what happens if something else occurs?
As Bob Farrell’s Rule Number 9 states:
“When all the experts and forecasts agree – something else is going to happen.
Here is some food for thought.
“The most fundamental premise of investing is to ‘buy when everyone is fearful.’ If excesses are built when everyone is on the same side of the trade, what should you do now?”
Risk Off Positioning Hits Extremes
We must evaluate the prevailing sentiment in the overall market to answer that question. Currently, market sentiment is extremely negative based on various measures, from investment positioning (what investors are doing in the market) to overall investor sentiment (how they feel about the market.}
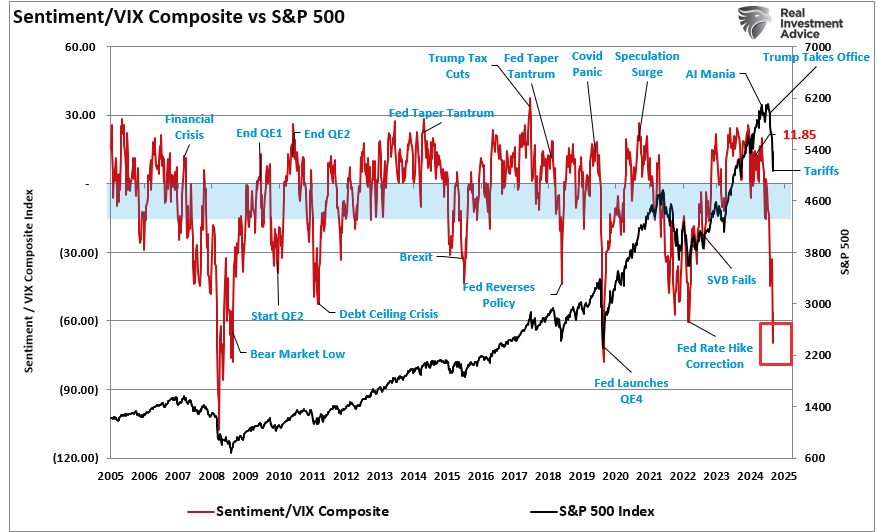
For example, net bullish sentiment among retail and institutional investors is at some of the lowest levels on record, including during the “Financial Crisis.” The extreme negativity is interesting because the recent decline was orderly and mild compared to the chaos during the financial crisis. Yet, investors are as bearish on the current market as they were then. However, it is worth noting that during previous instances when sentiment was as negative as it is currently, such readings were near market bottoms.
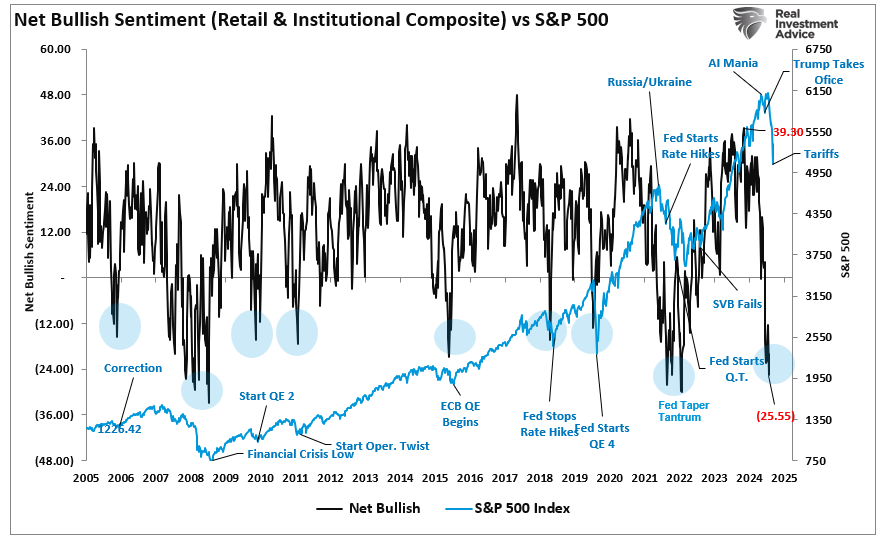
Furthermore, the sharp spike in the volatility index, which is considered a “market fear gauge,” spiked to the highest levels seen since the COVID pandemic. If we combine the sentiment measures with the volatility index, we again see more extreme negative readings that often coincide with market lows rather than the beginning of larger reversions.
Other Measures Of Extremes
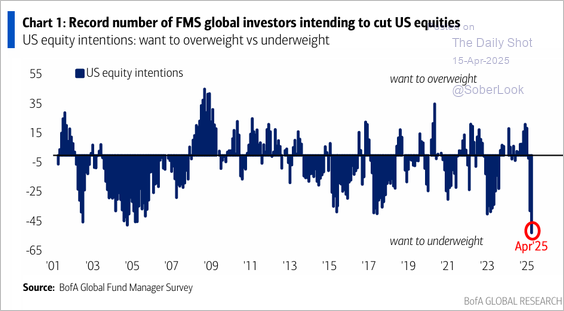
However, while our measures of fear and greed suggest that negative sentiment is reaching more extreme levels, other measures confirm the same. For example, the BofA survey of global investors intending to cut U.S. equities has been at its highest since the turn of the century. Such previous levels of negative sentiment on U.S. stocks have been a strong contrarian indicator for investors.
The same is shown by the rapid rotation out of U.S. stocks into foreign stocks. While many headlines are being written about that rotation, those duplicate headlines were written almost annually over the last 15 years. Due to strong economic and earnings forecasts, that rotation reverted into U.S. equities each time. In other words, the extremes in “sentiment” away from the U.S. were close to periods when investors should have been buying domestic equities.
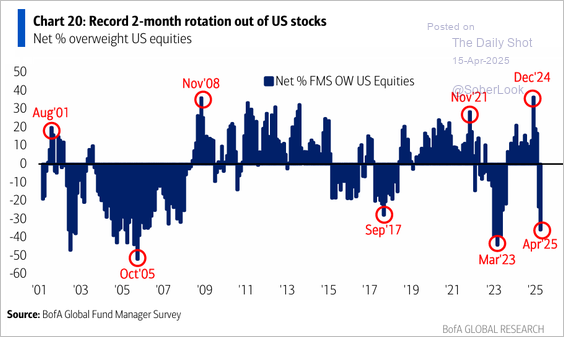
However, the current levels are generally consistent with market lows, even when we return our focus to just U.S. equity positioning.
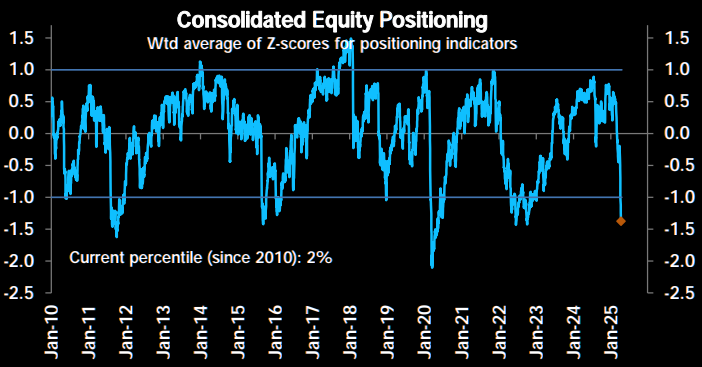
We see the same issue with professional funds that employ trading algorithms to manage equity exposure, which has also been reduced to levels more consistent with market lows rather than continued corrections.
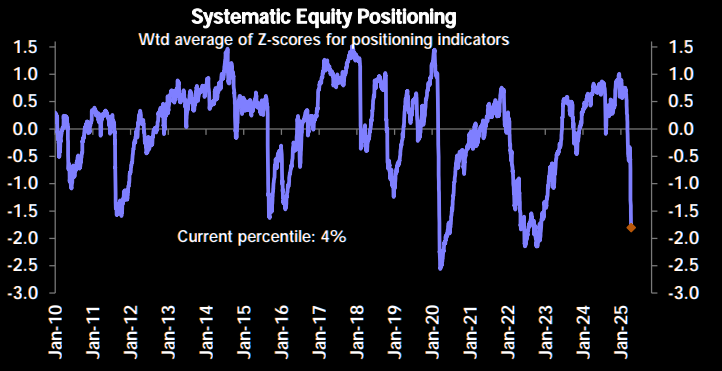
Lastly, institutional funds based on volatility control have also cut exposures sharply.

With equity exposures very low, if there is any “good news” forthcoming, either economically, politically, or earnings-wise, the chase by these fund managers to increase equity exposure will fuel a significant rise in the market. For most investors, by the time they realize the correction is over, it will be far too late to take advantage of the opportunity.
Risk-Off Technical Indicators Also Suggest A Potential Low
When overall risk-off sentiment and positioning are at levels normally coincident with market bottoming processes, the technical indicators have also become so risk-off that they signal risk-on behavior. As we discussed earlier this week, Sentimentrader.com had a great breakdown of various technical indicators, all hitting extremely low levels. Those indicators run the relative strength, breadth, and market momentum gamut.

Sentimentrader tracks 21 indicators in total, which are then combined into a single indicator, giving readings of when markets are trading at more extreme bullish or bearish levels. As shown, the market is currently trading at more extreme risk-off levels. While this does not mean the market is about to rise, historically, such extreme readings have been close to market bottoms.
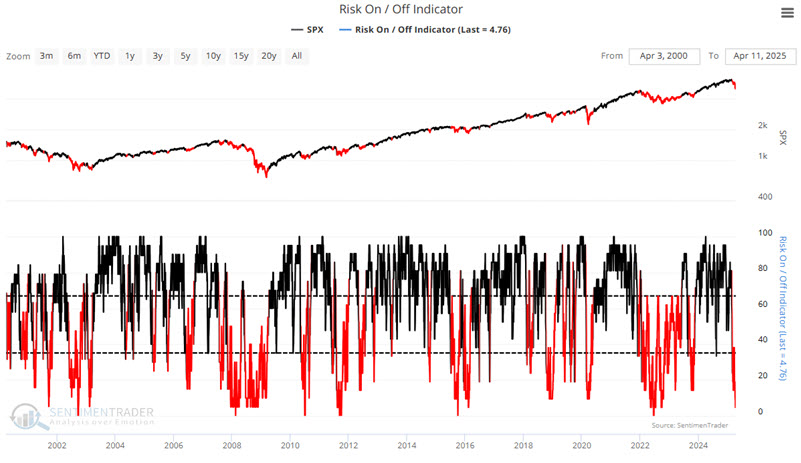
As Sentimentrader.com notes:
“Declines in the Risk On/Risk Off indicator below 35 have been associated with volatile periods in the market involving significant declines. “Playing defense” during these periods can, at times, help investors avoid some of the financial and psychological pain of riding significant drawdowns to the bottom fully invested. However, this indicator has gone so far to the unfavorable extreme that it might be “so bad that it’s good.”
Historically, when indicators reach such extreme levels, most previous advances or declines are likely complete. However, it does not mean that markets can not go even further into extremes before reaching a bottom. As Sentimentrader.com concluded:
“The good news is that – on a standalone basis – the signal and performance highlighted above make a compelling favorable case for stocks. The bad news is that we would never advise basing portfolio decisions on any one indicator or indicator signal. The proper message from the results above is NOT “All clear for stocks, and happy days are here again.” The proper message is “Ignore the bearish noise, manage risk, and keep an open mind to the potential for better results moving forward – but especially manage risk.”
We agree. Investors usually make psychological investment decisions during market declines to avoid further losses. That is entirely understandable, but as discussed previously, it is one of the leading causes of long-term underperformance.
We Are The Enemy, And The Enemy Is Me
The lesson is that headlines drive sentiment, and rallies can form when sentiment becomes too negative, as may be the case today. Does this mean the next major bull market rally is set to begin? No. But it does suggest that there are such high levels of negative sentiment that selling today will likely be a mistake.
The most significant problems for individuals are the “herding effect” and “loss aversion.” Notably, “loss aversion” is one of the leading factors influencing investment decisions, according to a survey from the CFA Institute.

“Loss aversion is a tendency in behavioral finance where investors are so fearful of losses that they focus on trying to avoid a loss more so than on making gains. The more one experiences losses, the more likely they are to become prone to loss aversion.” – Corporate Finance Institute
Unsurprisingly, investor psychology is one of the most significant reasons individuals consistently fail to achieve their investment goals. Our behavioral traits plague our investment decision-making.
Here is one last example. Price volatility, particularly when prices are declining rapidly, elicits our emotional response of panic. However, while rising volatility from low levels is a risk-off warning, high levels of volatility have often been a risk-on indicator. When the VIX closes above 45, which signals extreme investor fear, it has historically marked strong long-term buying opportunities. Following such spikes, the S&P 500 has more than doubled on average over five years, significantly outperforming periods of lower volatility. Opportunistic rebalancing during these dislocations can enhance long-term portfolio resilience.

George Dvorsky once wrote that:
“The human brain is capable of 1016 processes per second, which makes it far more powerful than any computer currently in existence. But that doesn’t mean our brains don’t have major limitations. The lowly calculator can do math thousands of times better than we can, and our memories are often less than useless — plus, we’re subject to cognitive biases, those annoying glitches in our thinking that cause us to make questionable decisions and reach erroneous conclusions.“
In other words:
“The most dangerous element to our success as investors…is ourselves.”
As a contrarian investor, excesses get built when everyone is on the same side of the trade.
From that basis, while it is easy to be very negative about the market currently, everyone is so bearish that the markets could respond in a manner no one expects.
We are not saying it will be the case, but we should be very open to the possibility.
How We Are Trading It
The problem with being a contrarian is determining where you are during a market cycle. The collective wisdom of market participants is generally “right” during the middle of a market advance but “wrong” at market peaks and troughs. Therefore, there are some actions we can take to navigate the uncertainty.
- Move slowly. There is no rush to make dramatic changes. Doing anything in a moment of “panic” tends to be the wrong thing.
- If you are overweight equities, DO NOT try to fully adjust your portfolio to your target allocation in one move. Again, after significant declines, individuals feel like they “must” do something. Think logically about where you want to be and use the rally to adjust to that level.
- Begin by selling laggards and losers. These positions were dragging on performance as the market rose, and they led the way down.
- Add to sectors, or positions, that are performing with or outperforming the broader market if you need risk exposure.
- Move “stop-loss” levels up to recent lows for each position. Managing a portfolio without “stop-loss” levels is like driving with your eyes closed.
- Be prepared to sell into the rally and reduce overall portfolio risk. You will sell many positions at a loss simply because you overpaid for them. Selling at a loss DOES NOT make you a loser. It just means you made a mistake.
- If none of this makes sense, please consider hiring someone to manage your portfolio. It will be worth the additional expense over the long term.
Just remember:
“In good times, skepticism means recognizing the things that are too good to be true; that’s something everyone knows. But in bad times, it requires sensing when things are too bad to be true. People have a hard time doing that. The things that terrify other people will probably terrify you too, but to be successful, an investor has to be a stalwart. After all, most of the time the world doesn’t end, and if you invest when everyone else thinks it will, you’re apt to get some bargains.“
Feel free to reach out if you want to navigate these uncertain waters with expert guidance. Our team specializes in helping clients make informed decisions in today’s volatile markets.
Research Report
Subscribe To “Before The Bell” For Daily Trading Updates
We have set up a separate channel JUST for our short daily market updates. Please subscribe to THIS CHANNEL to receive daily notifications before the market opens.
Click Here And Then Click The SUBSCRIBE Button
Subscribe To Our YouTube Channel To Get Notified Of All Our Videos
Bull Bear Report Market Statistics & Screens

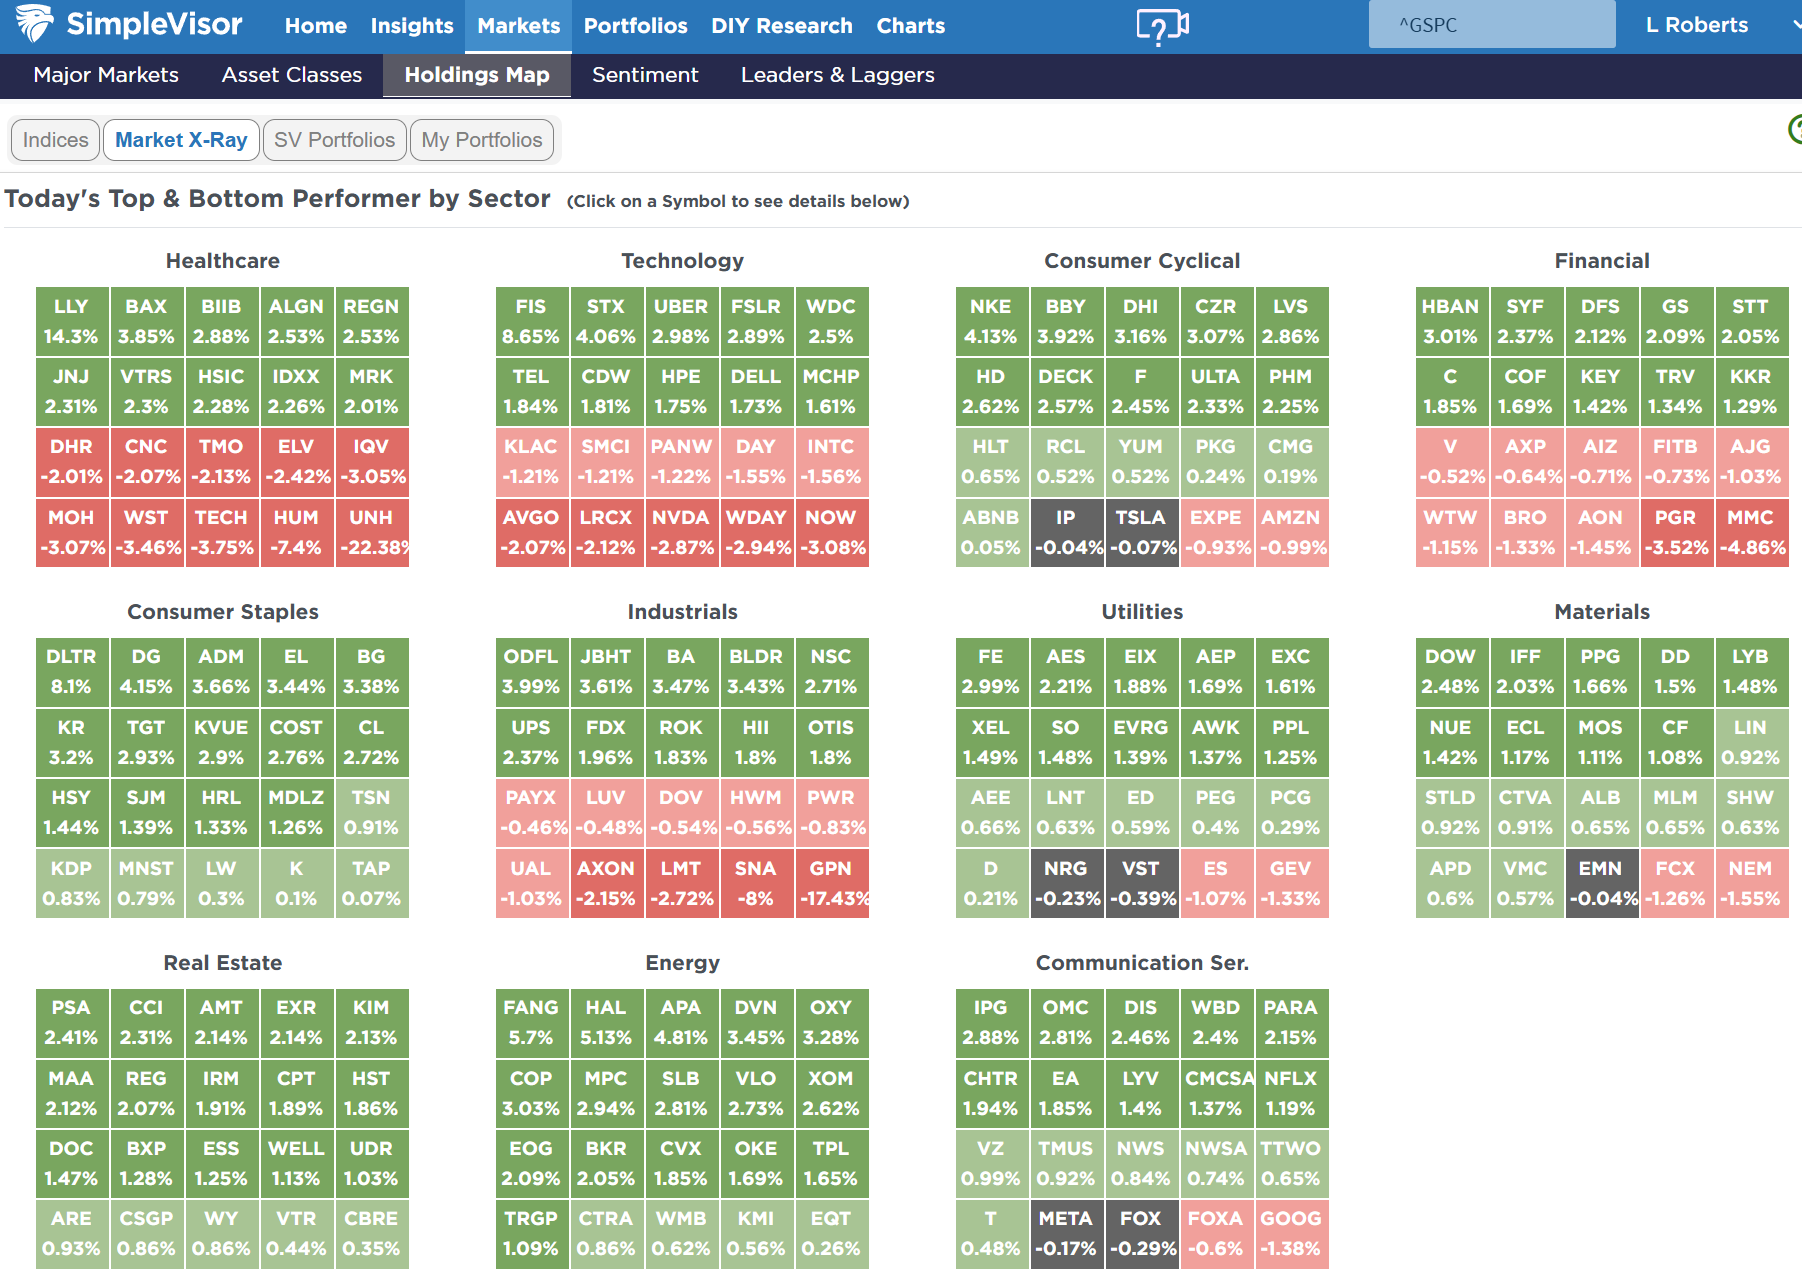
SimpleVisor Top & Bottom Performers By Sector
S&P 500 Weekly Tear Sheet
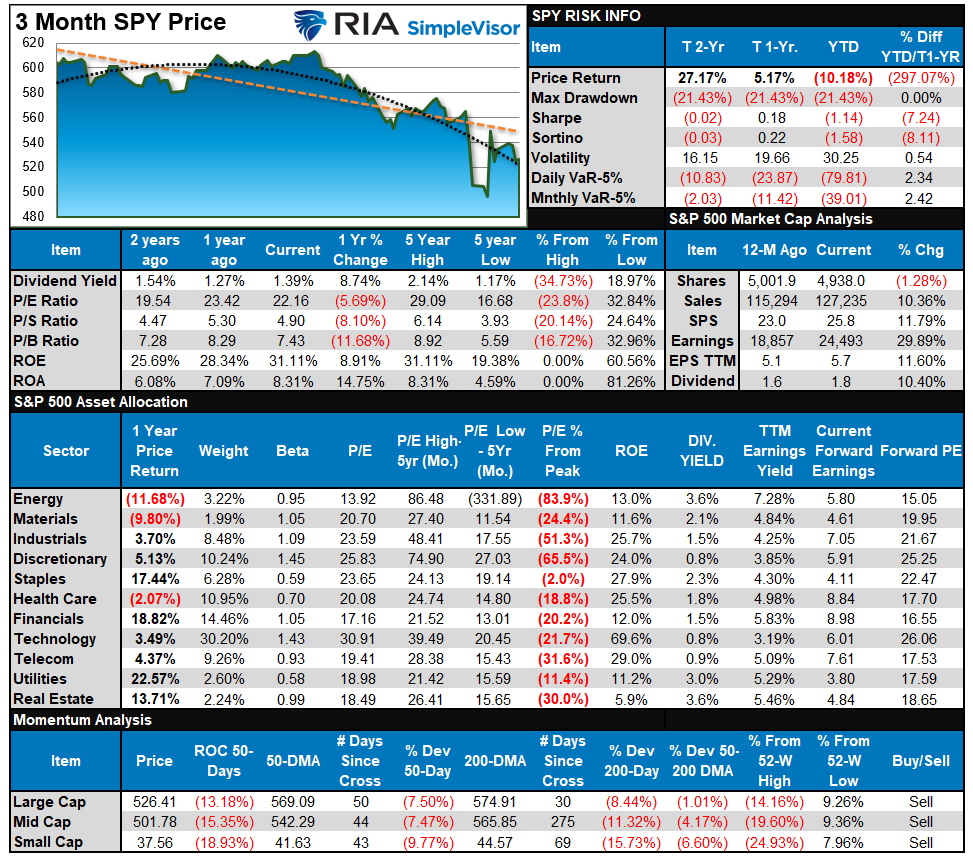
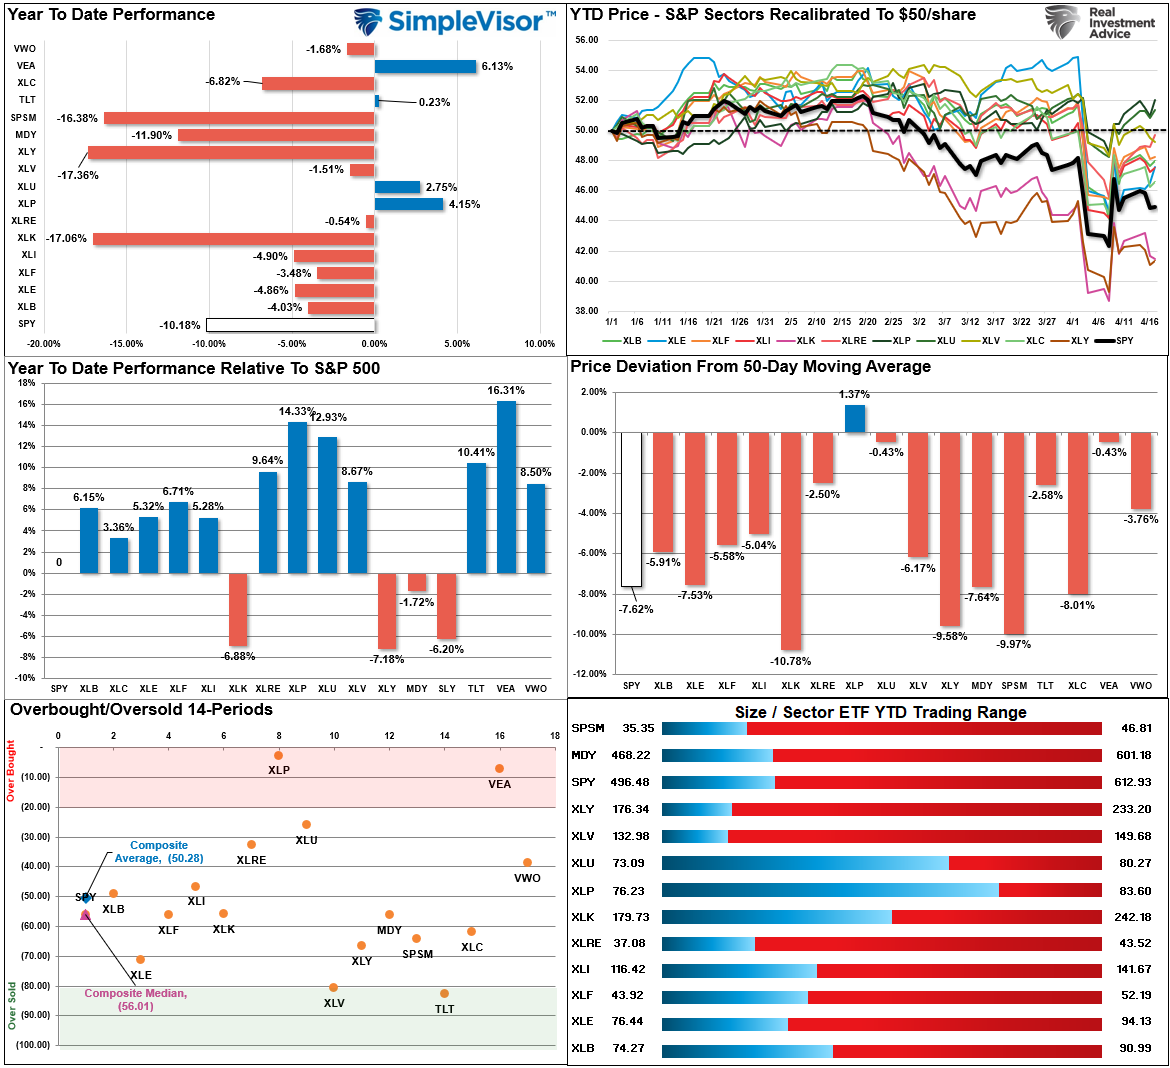
Relative Performance Analysis
Stocks had another volatile week of trading as the bond market remains pressured by the leverage unwind. The good news is that the market is not overbought. The bad news is that the markets aren’t oversold yet. While risk is subsiding in the near term, there is a lack of a catalyst to move stocks higher. Some good news on the tariff front or better-than-expected earnings over the next two weeks could certainly provide some needed relief. However, by the end of the month, stock buybacks return, which will give some support to equities headed into May.
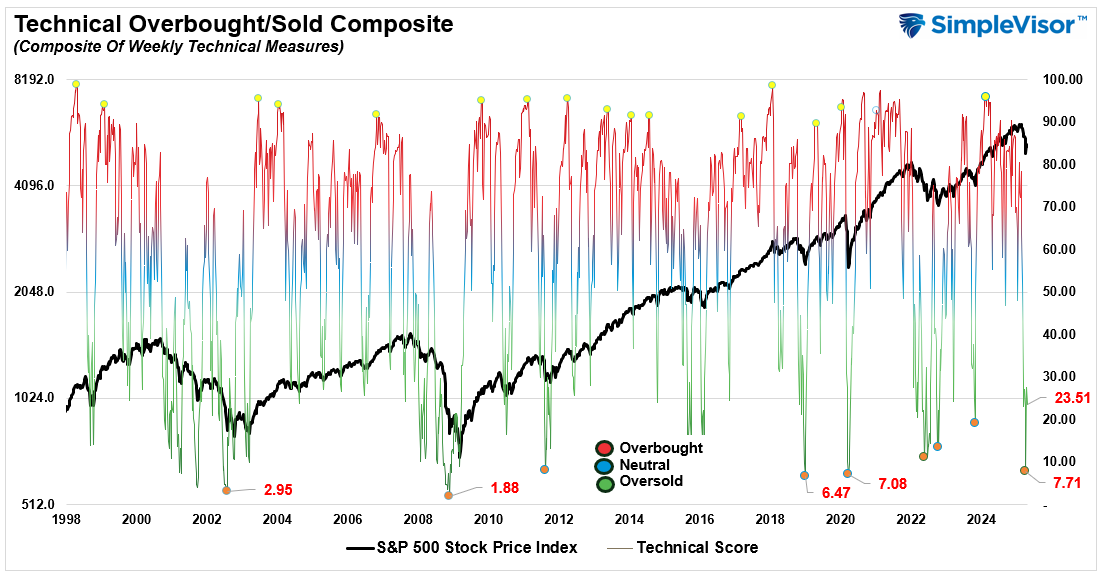
Technical Composite
The technical overbought/sold gauge comprises several price indicators (R.S.I., Williams %R, etc.), measured using “weekly” closing price data. Readings above “80” are considered overbought, and below “20” are oversold. The market peaks when those readings are 80 or above, suggesting prudent profit-taking and risk management. The best buying opportunities exist when those readings are 20 or below.
The current reading is 23.51 out of a possible 100.
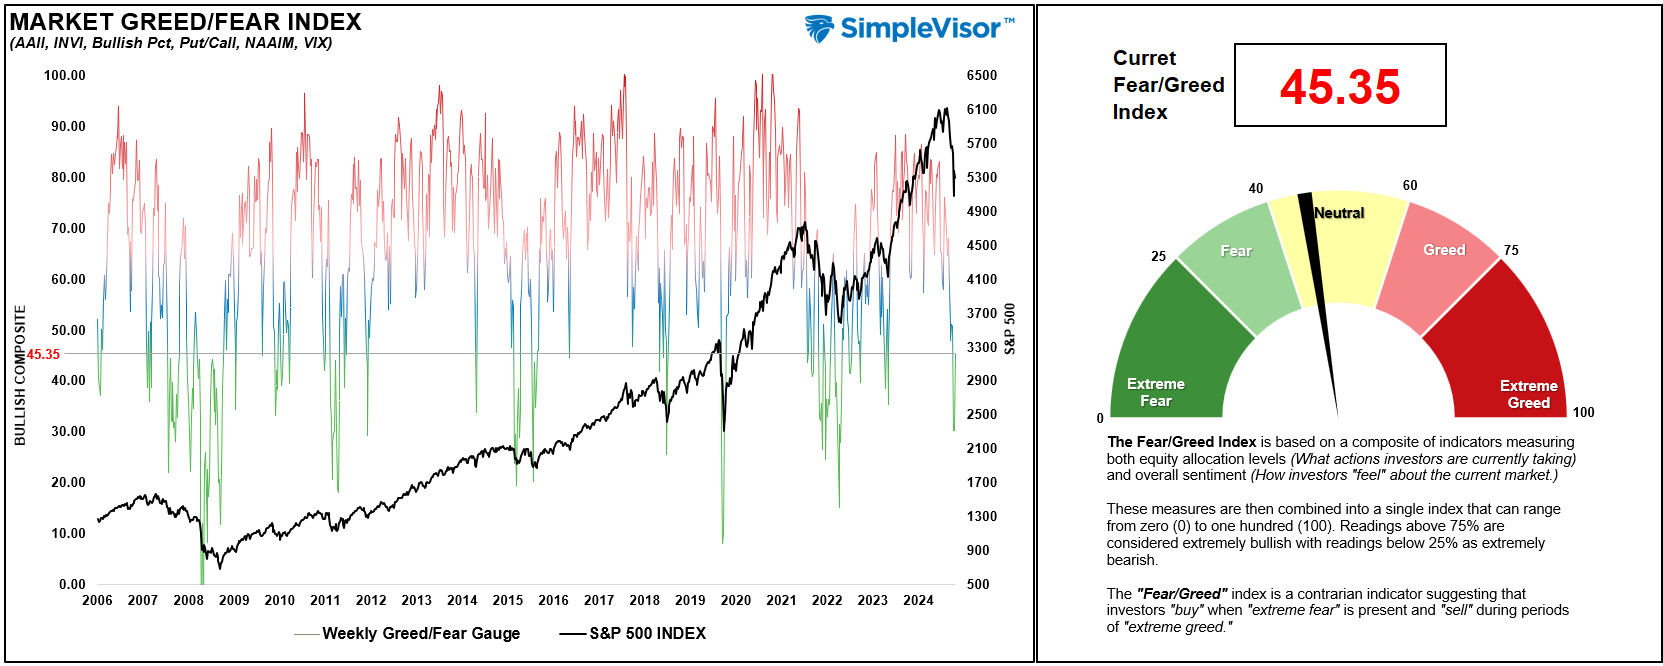
Portfolio Positioning “Fear / Greed” Gauge
The “Fear/Greed” gauge is how individual and professional investors are “positioning” themselves in the market based on their equity exposure. From a contrarian position, the higher the allocation to equities, the more likely the market is closer to a correction than not. The gauge uses weekly closing data.
NOTE: The Fear/Greed Index measures risk from 0 to 100. It is a rarity that it reaches levels above 90.
The current reading is 45.35 out of a possible 100.
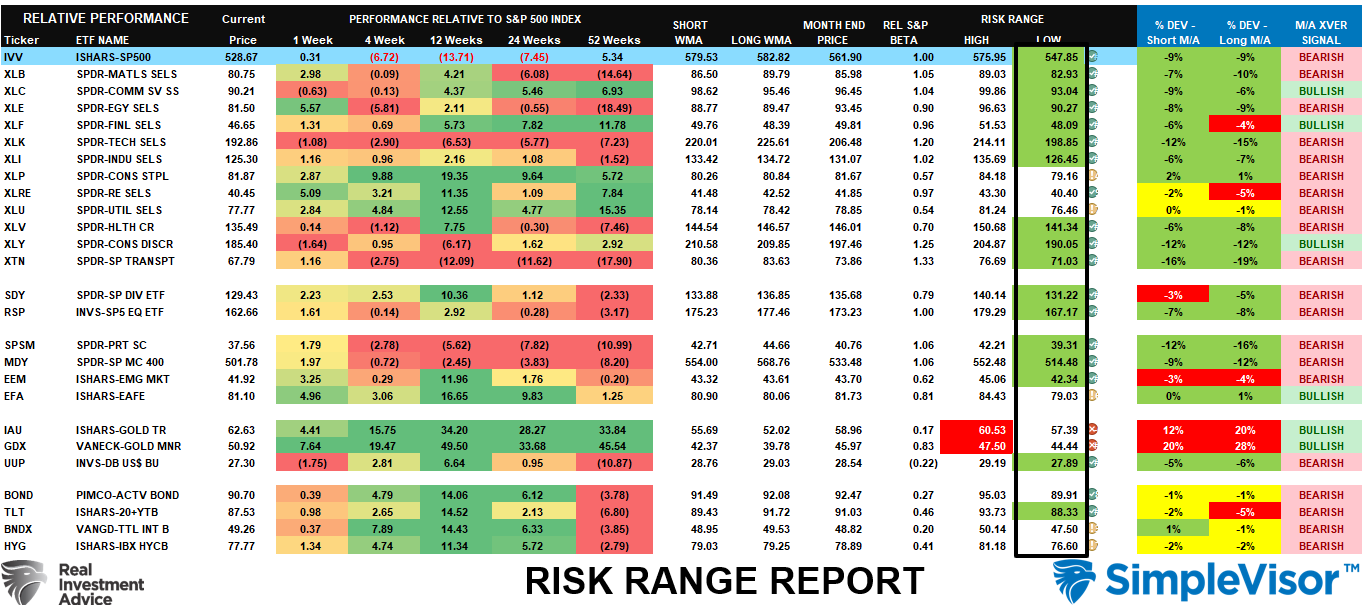
Relative Sector Analysis

Most Oversold Sector Analysis
Sector Model Analysis & Risk Ranges
How To Read This Table
- The table compares the relative performance of each sector and market to the S&P 500 index.
- “MA XVER” (Moving Average Crossover) is determined by the short-term weekly moving average crossing positively or negatively with the long-term weekly moving average.
- The risk range is a function of the month-end closing price and the “beta” of the sector or market. (Ranges reset on the 1st of each month)
- The table shows the price deviation above and below the weekly moving averages.
The recent correction has pushed most markets and sectors below their normal risk ranges. Gold is exceedingly overbought and deviated from long-term averages. Look to take profits and rebalance risks accordingly. With most markets and sectors on bearish crossover signals, the market likely has more work to do before the current correction process is complete. Continue to carry higher levels of cash and hedges for now.
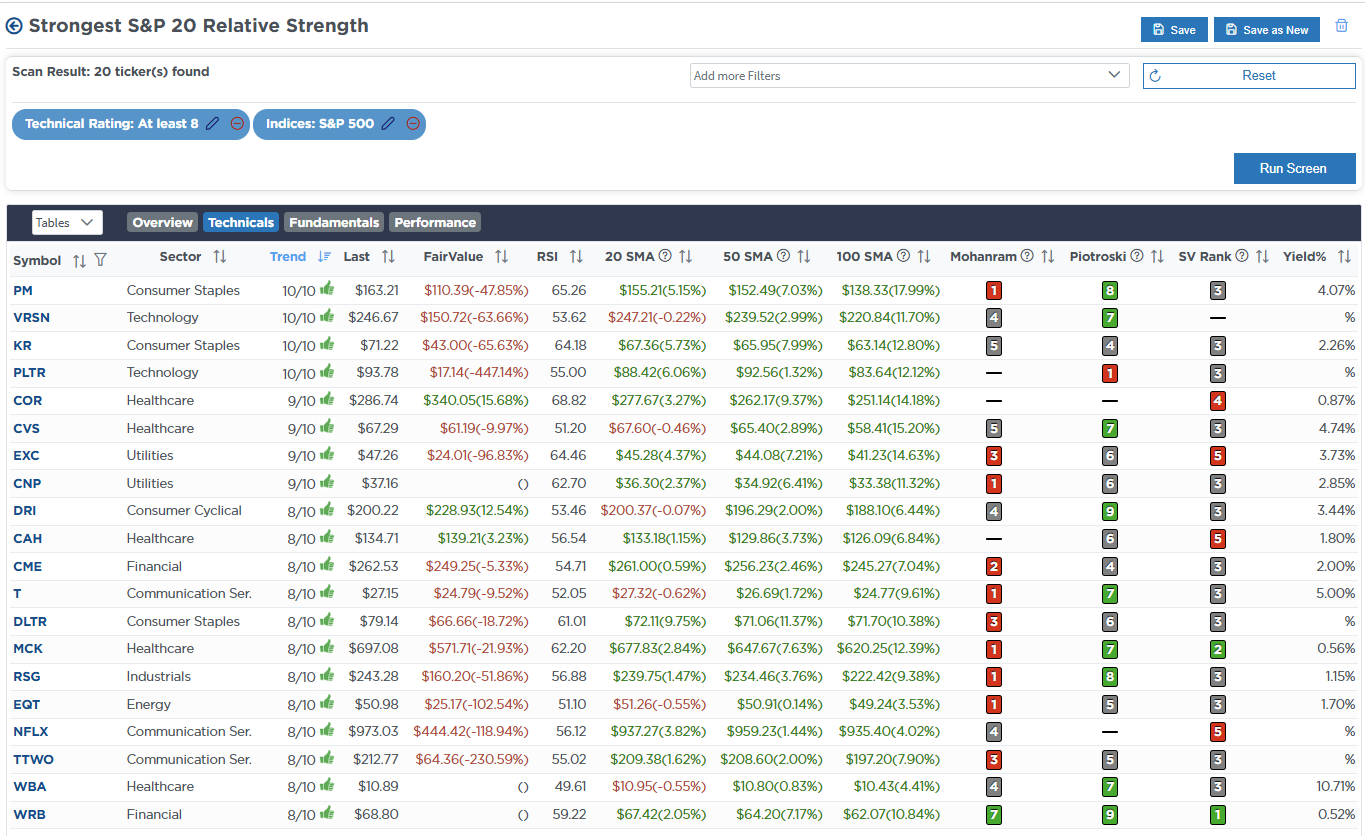
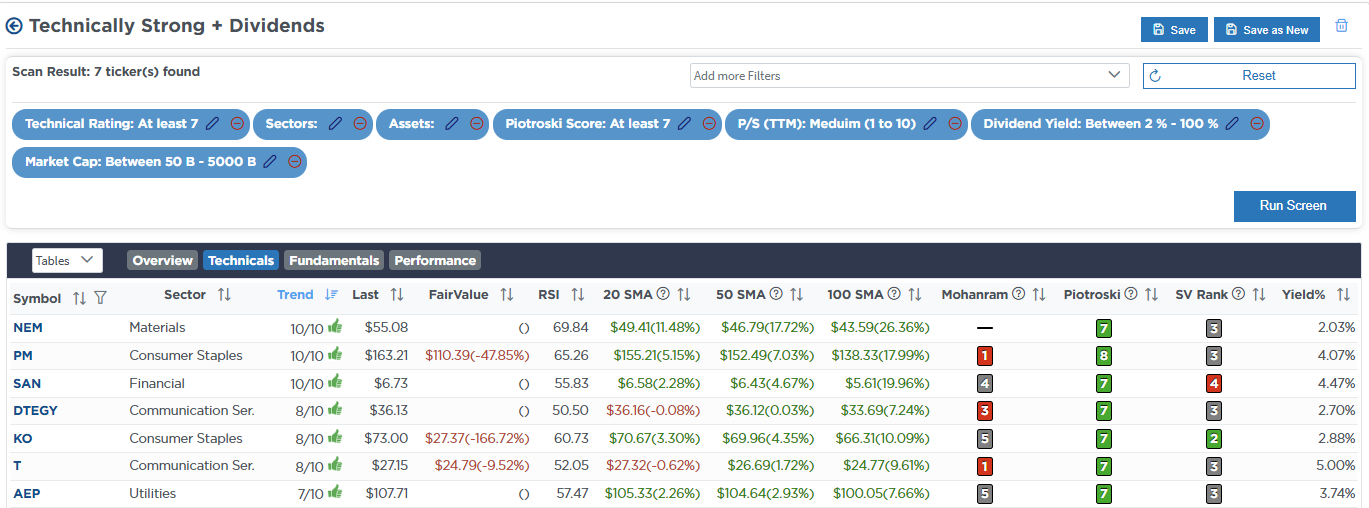
Weekly SimpleVisor Stock Screens
We provide three stock screens each week from SimpleVisor.
This week, we are searching for the Top 20:
- Relative Strength Stocks
- Momentum Stocks
- Technical Strength W/ Dividends
(Click Images To Enlarge)
RSI Screen
Momentum Screen

Technically Strong With Dividends
SimpleVisor Portfolio Changes
We post all of our portfolio changes as they occur at SimpleVisor:
Apr 14th
Oil has been extremely beaten up lately, with concerns over tariffs, slowing economic growth, and falling inflation. Likewise, energy stocks, which we sold over a month ago, have also been hit hard, with many trading three standard deviations below their means. We are picking up a trading position in energy stocks for a potential rally over the next few weeks. We will evaluate those positions regularly and rebalance them as needed. We are also running fairly tight stops in case the trade fails.
Equity Model
- Add 1% of the portfolio each in Exxon Mobil (XOM) and Diamondback Energy (FANG)
ETF Model
- Add a 2% position in the iShares Energy ETF (XLE)
Lance Roberts, C.I.O., RIA Advisors

