The Productivity–Pay Gap
Updated April 2025
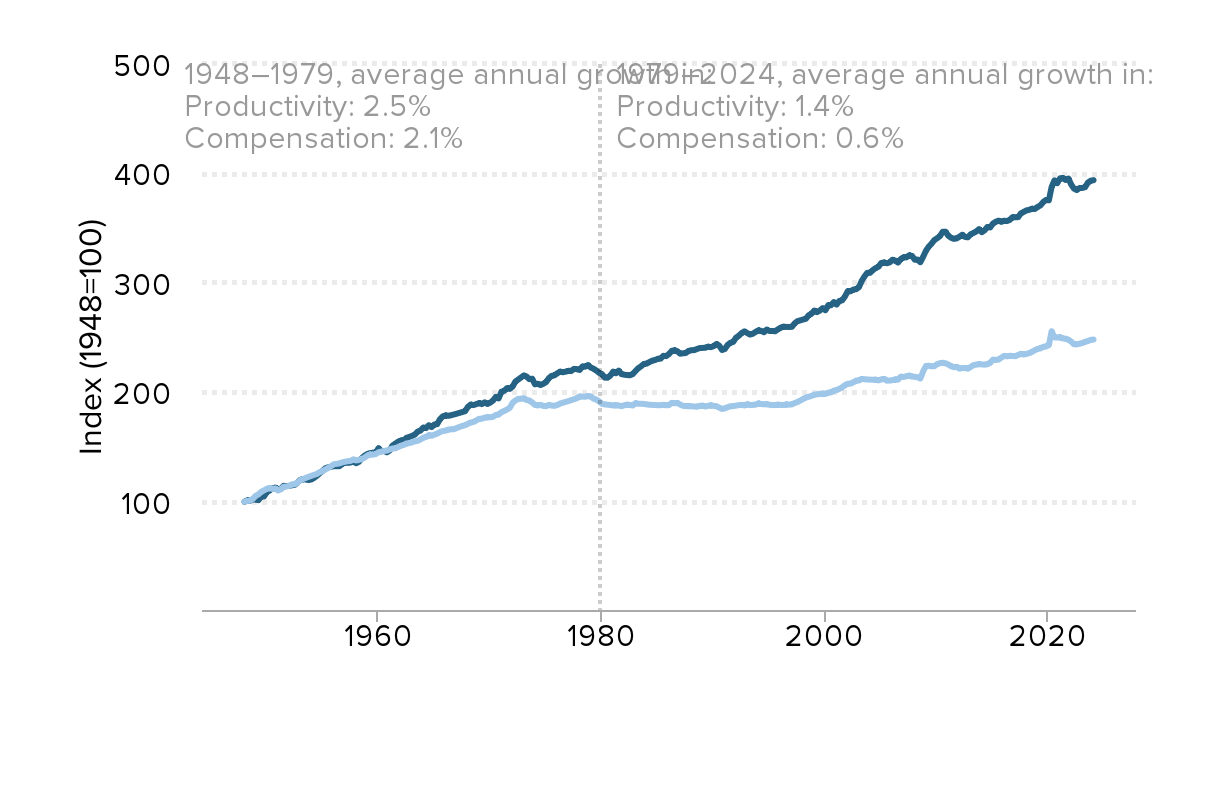
A rising tide should lift all boats. When the economy expands, everybody should reap the rewards. This outcome can either be guaranteed by smart and compassionate policy choices or subverted by policymakers choosing a different path. EPI’s Productivity-Pay Tracker shows a shift toward the latter: Since the late 1970s, our policy choices have led directly to a pronounced divergence between productivity and typical workers’ pay. But it didn’t have to be this way. A large majority of U.S. working families could have had significantly higher incomes today if policymakers had made different choices.
The gap between productivity and a typical worker’s compensation has increased dramatically since 1979: Productivity growth and hourly compensation growth, 1948–2024
| Year | Productivity | Pay |
|---|---|---|
| 1948q1 | 100 | 100 |
| 1948q2 | 101.2 | 100.8 |
| 1948q3 | 100.8 | 100.8 |
| 1948q4 | 102.7 | 103.1 |
| 1949q1 | 102.2 | 105.4 |
| 1949q2 | 101.3 | 106.6 |
| 1949q3 | 104.7 | 109 |
| 1949q4 | 104.7 | 110.3 |
| 1950q1 | 108.9 | 111.8 |
| 1950q2 | 110.1 | 112.4 |
| 1950q3 | 112.1 | 111.7 |
| 1950q4 | 112.9 | 112.1 |
| 1951q1 | 111.5 | 110.2 |
| 1951q2 | 111.6 | 111.2 |
| 1951q3 | 114.4 | 113.5 |
| 1951q4 | 114.3 | 113.7 |
| 1952q1 | 114.3 | 114.4 |
| 1952q2 | 114.9 | 115.8 |
| 1952q3 | 115.3 | 115.8 |
| 1952q4 | 117.5 | 117.3 |
| 1953q1 | 119.9 | 119.6 |
| 1953q2 | 120.5 | 120.6 |
| 1953q3 | 120.2 | 121.8 |
| 1953q4 | 119.7 | 122.6 |
| 1954q1 | 120.3 | 123.7 |
| 1954q2 | 121.8 | 124.5 |
| 1954q3 | 123.7 | 125.3 |
| 1954q4 | 126.8 | 127.8 |
| 1955q1 | 128.8 | 128.4 |
| 1955q2 | 131.2 | 130.2 |
| 1955q3 | 131.3 | 130.6 |
| 1955q4 | 131.8 | 132.3 |
| 1956q1 | 132.4 | 134.2 |
| 1956q2 | 132.3 | 134.5 |
| 1956q3 | 132.3 | 134.8 |
| 1956q4 | 134.3 | 135.8 |
| 1957q1 | 135.9 | 136.4 |
| 1957q2 | 136 | 137.5 |
| 1957q3 | 136.4 | 137.9 |
| 1957q4 | 136.5 | 138.5 |
| 1958q1 | 135 | 137.5 |
| 1958q2 | 136.3 | 138 |
| 1958q3 | 139.6 | 138.8 |
| 1958q4 | 141.9 | 140 |
| 1959q1 | 143.4 | 142 |
| 1959q2 | 144.2 | 143 |
| 1959q3 | 144.5 | 142.8 |
| 1959q4 | 144.5 | 143.3 |
| 1960q1 | 148 | 144.3 |
| 1960q2 | 145.9 | 145.6 |
| 1960q3 | 146.2 | 146.2 |
| 1960q4 | 144.9 | 146.5 |
| 1961q1 | 146.6 | 147.6 |
| 1961q2 | 151.1 | 148.4 |
| 1961q3 | 152.8 | 148.5 |
| 1961q4 | 153.8 | 149.1 |
| 1962q1 | 155.7 | 151 |
| 1962q2 | 155.6 | 151.6 |
| 1962q3 | 157.4 | 152.3 |
| 1962q4 | 158.9 | 153.3 |
| 1963q1 | 160.7 | 154.7 |
| 1963q2 | 161.8 | 155.8 |
| 1963q3 | 163.8 | 155.3 |
| 1963q4 | 165.4 | 157.2 |
| 1964q1 | 167.4 | 158 |
| 1964q2 | 167 | 158.6 |
| 1964q3 | 169.6 | 160.3 |
| 1964q4 | 168.7 | 160.4 |
| 1965q1 | 171.1 | 161.6 |
| 1965q2 | 171.4 | 162.4 |
| 1965q3 | 175 | 163.1 |
| 1965q4 | 178.5 | 164.8 |
| 1966q1 | 179.3 | 165.1 |
| 1966q2 | 178.2 | 165.4 |
| 1966q3 | 178.7 | 165.6 |
| 1966q4 | 179.4 | 165.7 |
| 1967q1 | 180.1 | 166.8 |
| 1967q2 | 181.7 | 168.5 |
| 1967q3 | 181.5 | 168.7 |
| 1967q4 | 182.3 | 169.2 |
| 1968q1 | 186.3 | 170.6 |
| 1968q2 | 187.6 | 171.1 |
| 1968q3 | 187.9 | 172.2 |
| 1968q4 | 188 | 172.9 |
| 1969q1 | 189.7 | 175.1 |
| 1969q2 | 188.8 | 175.1 |
| 1969q3 | 190.4 | 176.2 |
| 1969q4 | 189.6 | 177.2 |
| 1970q1 | 190.1 | 176.4 |
| 1970q2 | 191.9 | 176.8 |
| 1970q3 | 195.3 | 178.6 |
| 1970q4 | 193.9 | 178.9 |
| 1971q1 | 200 | 181.1 |
| 1971q2 | 200.8 | 182.1 |
| 1971q3 | 203.2 | 183.5 |
| 1971q4 | 202.6 | 184.9 |
| 1972q1 | 204.7 | 189.6 |
| 1972q2 | 209.2 | 191.6 |
| 1972q3 | 211 | 193.1 |
| 1972q4 | 213.7 | 193.9 |
| 1973q1 | 214.8 | 193.8 |
| 1973q2 | 213.8 | 192.1 |
| 1973q3 | 211.4 | 191.6 |
| 1973q4 | 211.8 | 189.9 |
| 1974q1 | 207.3 | 188.1 |
| 1974q2 | 207.8 | 187.6 |
| 1974q3 | 206 | 187.5 |
| 1974q4 | 207 | 186.6 |
| 1975q1 | 209.3 | 186.9 |
| 1975q2 | 212.2 | 187.5 |
| 1975q3 | 214.3 | 186.9 |
| 1975q4 | 214.7 | 186.6 |
| 1976q1 | 216.6 | 187.3 |
| 1976q2 | 218.1 | 188.7 |
| 1976q3 | 218.1 | 189.9 |
| 1976q4 | 218.6 | 190.7 |
| 1977q1 | 219.4 | 191.5 |
| 1977q2 | 218.6 | 191.8 |
| 1977q3 | 221.1 | 193.1 |
| 1977q4 | 220.3 | 193.5 |
| 1978q1 | 219.5 | 195 |
| 1978q2 | 222.7 | 195 |
| 1978q3 | 222.5 | 194.8 |
| 1978q4 | 224 | 195.4 |
| 1979q1 | 221.7 | 195.1 |
| 1979q2 | 220.7 | 193 |
| 1979q3 | 218.9 | 192.2 |
| 1979q4 | 216.8 | 190.7 |
| 1980q1 | 215.7 | 188.3 |
| 1980q2 | 212.9 | 188.2 |
| 1980q3 | 212.8 | 187.9 |
| 1980q4 | 214.7 | 187.7 |
| 1981q1 | 217.9 | 186.8 |
| 1981q2 | 216.8 | 187.3 |
| 1981q3 | 219.2 | 187.2 |
| 1981q4 | 216 | 186.5 |
| 1982q1 | 215.4 | 187.3 |
| 1982q2 | 215.1 | 187.8 |
| 1982q3 | 214.9 | 187.5 |
| 1982q4 | 215.9 | 187.1 |
| 1983q1 | 218.7 | 189.2 |
| 1983q2 | 221.7 | 188.9 |
| 1983q3 | 223 | 188.6 |
| 1983q4 | 225.2 | 188.5 |
| 1984q1 | 225.5 | 188 |
| 1984q2 | 226.9 | 187.7 |
| 1984q3 | 228.2 | 187.6 |
| 1984q4 | 228.7 | 187.4 |
| 1985q1 | 229.9 | 187.2 |
| 1985q2 | 229.9 | 187.3 |
| 1985q3 | 232.5 | 187.6 |
| 1985q4 | 232.3 | 187.2 |
| 1986q1 | 234.2 | 187.4 |
| 1986q2 | 237.1 | 189.4 |
| 1986q3 | 237.9 | 189.4 |
| 1986q4 | 236.7 | 189.3 |
| 1987q1 | 234.5 | 187.8 |
| 1987q2 | 235.2 | 187 |
| 1987q3 | 235.1 | 186.4 |
| 1987q4 | 237 | 186.4 |
| 1988q1 | 237.6 | 186.3 |
| 1988q2 | 238 | 186.4 |
| 1988q3 | 239 | 186.1 |
| 1988q4 | 239.6 | 186.7 |
| 1989q1 | 239.7 | 186.8 |
| 1989q2 | 239.8 | 186 |
| 1989q3 | 240.8 | 186.6 |
| 1989q4 | 240.4 | 187.1 |
| 1990q1 | 241.6 | 186.8 |
| 1990q2 | 243.5 | 186.6 |
| 1990q3 | 241.7 | 184.9 |
| 1990q4 | 237.7 | 183.8 |
| 1991q1 | 238.9 | 184.5 |
| 1991q2 | 242.7 | 185.7 |
| 1991q3 | 244.3 | 186.2 |
| 1991q4 | 245.1 | 186.4 |
| 1992q1 | 249 | 186.7 |
| 1992q2 | 250.9 | 187.4 |
| 1992q3 | 253.5 | 187.7 |
| 1992q4 | 254.6 | 187 |
| 1993q1 | 253.4 | 188.3 |
| 1993q2 | 252 | 187.5 |
| 1993q3 | 252.8 | 187.7 |
| 1993q4 | 254.5 | 187.8 |
| 1994q1 | 255.6 | 188.8 |
| 1994q2 | 255.1 | 188.2 |
| 1994q3 | 253.8 | 188 |
| 1994q4 | 256.3 | 188.2 |
| 1995q1 | 255 | 187.5 |
| 1995q2 | 255 | 187.2 |
| 1995q3 | 255 | 187.5 |
| 1995q4 | 256.8 | 187.8 |
| 1996q1 | 258.3 | 187.6 |
| 1996q2 | 259.1 | 187.5 |
| 1996q3 | 259 | 188.1 |
| 1996q4 | 258.9 | 187.9 |
| 1997q1 | 259.3 | 188.3 |
| 1997q2 | 262.2 | 189.4 |
| 1997q3 | 264.4 | 190.4 |
| 1997q4 | 264.9 | 191.6 |
| 1998q1 | 265.7 | 192.9 |
| 1998q2 | 266.3 | 194.3 |
| 1998q3 | 269.5 | 195 |
| 1998q4 | 270.9 | 195.8 |
| 1999q1 | 273.8 | 196.9 |
| 1999q2 | 272.4 | 197.2 |
| 1999q3 | 273.8 | 197.7 |
| 1999q4 | 276.3 | 198 |
| 2000q1 | 273.2 | 196.9 |
| 2000q2 | 277.9 | 198.1 |
| 2000q3 | 277.8 | 198.4 |
| 2000q4 | 280.7 | 200 |
| 2001q1 | 278.4 | 200.4 |
| 2001q2 | 281.7 | 201.6 |
| 2001q3 | 282.2 | 202.9 |
| 2001q4 | 285.8 | 205 |
| 2002q1 | 290.7 | 206.3 |
| 2002q2 | 290.5 | 206.3 |
| 2002q3 | 292 | 207.5 |
| 2002q4 | 292.4 | 209.1 |
| 2003q1 | 294.2 | 209.2 |
| 2003q2 | 299.9 | 210.6 |
| 2003q3 | 304 | 210.4 |
| 2003q4 | 307.3 | 210 |
| 2004q1 | 307.3 | 210 |
| 2004q2 | 309.9 | 209.8 |
| 2004q3 | 311.6 | 210 |
| 2004q4 | 312.8 | 209.3 |
| 2005q1 | 316.2 | 210.2 |
| 2005q2 | 316.7 | 210.5 |
| 2005q3 | 315.9 | 209.1 |
| 2005q4 | 316.7 | 209 |
| 2006q1 | 319.1 | 209.6 |
| 2006q2 | 318.4 | 210.1 |
| 2006q3 | 316.6 | 210 |
| 2006q4 | 319.8 | 212.6 |
| 2007q1 | 321.4 | 212.5 |
| 2007q2 | 321.3 | 212.9 |
| 2007q3 | 323.2 | 213.7 |
| 2007q4 | 322.7 | 212.7 |
| 2008q1 | 319.2 | 212.6 |
| 2008q2 | 319.3 | 212.2 |
| 2008q3 | 316.9 | 211 |
| 2008q4 | 321.9 | 217.6 |
| 2009q1 | 327.4 | 222.4 |
| 2009q2 | 331.1 | 222.5 |
| 2009q3 | 333.7 | 222.1 |
| 2009q4 | 337.1 | 222.1 |
| 2010q1 | 338.7 | 224 |
| 2010q2 | 340.6 | 224.9 |
| 2010q3 | 344.6 | 225.2 |
| 2010q4 | 344.7 | 224.8 |
| 2011q1 | 341 | 223.7 |
| 2011q2 | 339.1 | 222.1 |
| 2011q3 | 338.2 | 221.3 |
| 2011q4 | 338.6 | 221.4 |
| 2012q1 | 340.1 | 219.9 |
| 2012q2 | 341.9 | 220.4 |
| 2012q3 | 339.9 | 220.6 |
| 2012q4 | 339.6 | 219.8 |
| 2013q1 | 342.4 | 221.4 |
| 2013q2 | 343.5 | 223.1 |
| 2013q3 | 344.8 | 223.5 |
| 2013q4 | 347 | 224 |
| 2014q1 | 344.2 | 223.7 |
| 2014q2 | 345.9 | 223.5 |
| 2014q3 | 349 | 223.9 |
| 2014q4 | 348.5 | 225.2 |
| 2015q1 | 352.1 | 228.1 |
| 2015q2 | 353.7 | 227.8 |
| 2015q3 | 354.7 | 228.2 |
| 2015q4 | 353.6 | 229.9 |
| 2016q1 | 354.6 | 231.5 |
| 2016q2 | 354.4 | 231.1 |
| 2016q3 | 355.4 | 231.5 |
| 2016q4 | 357.9 | 231.4 |
| 2017q1 | 357.8 | 231.2 |
| 2017q2 | 357.9 | 232.4 |
| 2017q3 | 361.4 | 233.2 |
| 2017q4 | 362.7 | 232.8 |
| 2018q1 | 364 | 233.2 |
| 2018q2 | 364.5 | 234.1 |
| 2018q3 | 365.5 | 235.2 |
| 2018q4 | 365.2 | 236.7 |
| 2019q1 | 367.3 | 237.7 |
| 2019q2 | 368.8 | 238.3 |
| 2019q3 | 372.1 | 239.6 |
| 2019q4 | 374.1 | 240 |
| 2020q1 | 372.7 | 241 |
| 2020q2 | 385.7 | 253.7 |
| 2020q3 | 392.3 | 248.2 |
| 2020q4 | 389.5 | 248.1 |
| 2021q1 | 394.1 | 248.5 |
| 2021q2 | 394.9 | 247.5 |
| 2021q3 | 393.9 | 247.4 |
| 2021q4 | 395 | 246 |
| 2022q1 | 390.9 | 244.3 |
| 2022q2 | 388.3 | 241.9 |
| 2022q3 | 387.3 | 241.6 |
| 2022q4 | 389.8 | 242.5 |
| 2023q1 | 390.7 | 243.5 |
| 2023q2 | 391.7 | 245 |
| 2023q3 | 396.2 | 245.8 |
| 2023q4 | 397.9 | 247.1 |
| 2024q1 | 399.4 | 247.3 |
| 2024q2 | 401 | 248.2 |
| 2024q3 | 402.9 | 250.4 |
| 2024q4 | 404.3 | 251.2 |
Notes: Data are for compensation (wages and benefits) of production/nonsupervisory workers in the private sector and net productivity of the total economy. “Net productivity” is the growth of output of goods and services less depreciation per hour worked.
Source: EPI analysis of unpublished Total Economy Productivity data from Bureau of Labor Statistics (BLS) Labor Productivity and Costs program, wage data from the BLS Current Employment Statistics, BLS Employment Cost Trends, BLS Consumer Price Index, and Bureau of Economic Analysis National Income and Product Accounts.
What is productivity, and why did pay and productivity once climb together?
Productivity measures how much income is generated (for workers, business owners, landlords, and everyone else together) in an average hour of work in the economy. As productivity grows and each hour of work generates more and more income on average over time, it creates the potential for improving living standards for everyone.
In the figure above, pay is defined as the average compensation (wages and benefits) of production and nonsupervisory workers. This group makes up roughly 80% of the U.S workforce, but nonsupervisory workers exclude extremely highly paid managerial workers like CEOs and other corporate executives. As the figure shows, pay for these nonsupervisory workers climbed together with productivity from 1948 until the late 1970s. But that didn’t happen by accident. It happened because specific policies were adopted with the intentional goal of spreading the benefits of growth broadly across income classes. When this intentional policy target of equitable growth was abandoned in the late 1970s and afterward, pay and productivity diverged. Relinking pay and productivity so that workers share in the fruits of their labor will require another pronounced shift in policy.
What broke the link between pay and productivity?
Starting in the late 1970s policymakers began dismantling all the policy bulwarks helping to ensure that typical workers’ wages grew with productivity. Excess unemployment was tolerated to keep any chance of inflation in check. Raises in the federal minimum wage became smaller and rarer. Labor law failed to keep pace with growing employer hostility toward unions. Tax rates on top incomes were lowered. And anti-worker deregulatory pushes—from the deregulation of the trucking and airline industries to the retreat of anti-trust policy to the dismantling of financial regulations and more—succeeded again and again.
In essence, policy choices made to suppress wage growth prevented potential pay growth fueled by rising productivity from translating into actual pay growth for most workers. The result of this policy shift was the sharp divergence between productivity and typical workers’ pay shown in the graph.
A closer look at the trend lines reveals another important piece of information. After 1979, productivity grew at a significantly slower pace relative to previous decades. But because pay growth for typical workers decelerated even more markedly, a large wedge between productivity and pay emerged. The growing gap amid slowing productivity growth tells us that the same set of policies that suppressed pay growth for the vast majority of workers over the last 40 years were also associated with a slowdown in overall economic growth. In short, economic growth became both slower and more radically unequal.
If the fruits of economic growth are not going to workers, where are they going?
The growing wedge between productivity and typical workers’ pay is income going everywhere but the paychecks of the bottom 80% of workers. If it didn’t end up in paychecks of typical workers, where did all the income growth implied by the rising productivity line go? Two places, basically. It went into the salaries of highly paid corporate and professional employees. And it went into higher profits (returns to shareholders and other wealth owners). This concentration of wage income at the top (growing wage inequality) and the shift of income from labor overall and toward capital owners (the loss in labor’s share of income) are two of the key drivers of economic inequality overall since the late 1970s.
Where can I learn more about the productivity–pay gap and how to close it?
A series of EPI reports over the last several years track wage trends and racial wage gaps and their relation to the productivity–pay disconnect. Two foundational papers explain in detail how we measure the productivity–pay gap and why broad-based wage growth is our central economic challenge.
How does EPI construct the productivity–pay graph?
EPI makes a series of data choices to construct the indices of productivity and pay in the chart above. Our data choices reflect our end goal: to compare growth in the typical worker’s pay with the potential growth in living standards (consumption) that productivity growth represents, with an eye to identifying how much rising inequality has put a wedge between these measures.
In brief, we begin with a measure of labor productivity—economywide income divided by total hours worked in the economy. We measure productivity for the entire economy—not just the “nonfarm business sector” that is the focus of much economic commentary. This total economy measure includes outputs from farms, government agencies, and nonprofits. We adjust these calculations for depreciation and then further for price inflation.
The pay measure starts with the average hourly wage of production and nonsupervisory workers in the private sector, who account for roughly 80% of private-sector workers and thus are a good proxy for the “typical” worker. We adjust this wage for inflation and add inflation-adjusted estimates for benefits.
How does EPI’s productivity–pay graph compare with other versions?
EPI’s productivity–pay graph helps answer a crucial question: Do typical workers in the United States share in the benefits of economic growth? The big and growing gap between productivity and pay growth answers that with a resounding “no.” But in order to see this clearly, all of the adjustments we have made to the data are necessary. Failing to make these data adjustments leads to incorrect conclusions about how much the rise of inequality has delinked productivity and pay for typical workers.
How much of the productivity–pay gap is driven by inequality?
The entire gap in EPI’s productivity–pay figure is associated with rising inequality—inequality among wage earners and the rising share of overall income going to owners of capital rather than to workers for their labor. However, since researchers and analysts may still be interested in factors that account for various parts of the wedge between our measure of pay and other measures of productivity, we decompose these gaps further.