How Many Cars Are
In the US?
US Vehicle Registration Statistics

US Vehicle Registration Statistics
US Vehicle Registration Statistics
June 11, 2025
This page gives a snapshot of how many cars are in the US in 2025. Hedges & Company did an analysis in January 2025 and estimates there are 298.7 million registered vehicles in the US, including classic cars, pre-1982 vehicles, and all light, medium and heavy duty vehicles.
“Cars in the US” is used generically and this actually includes trucks, SUVs and vans. Hedges & Company has been tracking vehicles in operation (VIO) and the number of cars and other vehicles in the US for 15 years.
Automobile statistics take into account every car-owning household in the nation including vehicle owner demographics by year, make and model, GVWR classes, household income, employment, married status, consumer buying histories, ethnicity and more.
TL;DR: Hedges & Company estimates there are about 132.8 million households1 at the start of 2025. Of those US households, about 121.6 million households2 have a car. To put it another way, 92% of all US households have a car.
10.4 million US households don’t have a car in 20242 or 8% of US households don’t have a car.
If need to reach new customers and grow your sales, rely on the most complete and current consumer mailing lists in the automotive aftermarket. Our vehicle ownership masterfile has the year, make and model of 170 million US consumers including automobile, truck and motorcycle owners, and we can drill down to DIY consumers with a buying history of aftermarket parts and accessories.
For mailing lists, see our automobile mailing list page, or auto dealers may be interested in our automotive direct mail list page. If you want to know how many cars there are in the world, follow that link.
1US Census Bureau, Families and Households survey, Hedges & Company projection
2US Bureau of Transportation, Hedges & Company analysis
This table includes all passenger cars, light trucks and SUVs, as well as medium duty and heavy duty trucks. We’re estimating 298.7 million registered vehicles in the US, including classic cars, pre-1982 vehicles, and all light, medium and heavy duty vehicles.
| Registered Vehicles in US By Year | Vehicle Registration Statistics |
|---|---|
| Registered vehicles in US 2025 (proj.) | 298.7 million |
| Registered vehicles in US 2024 | 296.6 million |
| Registered vehicles in US 2023 | 292.3 million |
| Registered vehicles in US 2022 | 290.8 million |
| Registered vehicles in US 2021 | 289.5 million |
| Registered vehicles in US 2020 | 286.9 million |
| Registered vehicles in US 2019 | 284.5 million |
| Registered vehicles in US 2018 | 279.1 million |
| Registered vehicles in US 2017 | 270.4 million |
| Registered vehicles in US 2016 | 264.0 million |
| Registered vehicles in US 2015 | 257.9 million |
| Registered vehicles in US 2014 | 252.6 million |
| Registered vehicles in US 2013 | 248.9 million |
| Registered vehicles in US 2012 | 248.7 million |
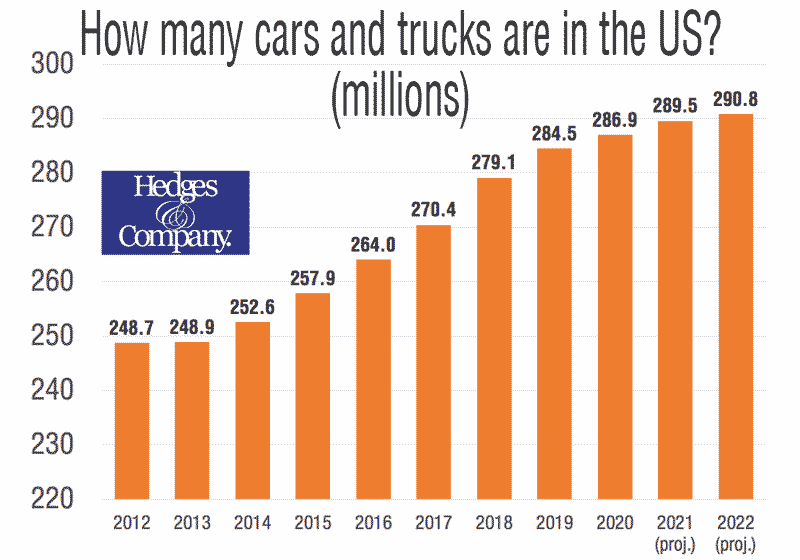
This table includes light-duty vehicles as well as medium- and heavy-duty vehicles, GVWR classes 4-8, which are often left off of VIO counts seen around the internet. This table also includes vehicles with a VIN year of 1982 and earlier, and these older vehicles are also often left off of VIO counts, too.
CLICK TO ENLARGE: Graph showing how many trucks and cars in the US by year. Right click to save this graph as an image.
There are 298.7 million vehicles on the road in the US in 2025 and they’re getting older.
All light vehicles, combining cars and light trucks, have an average age of 12.8 years in 2025, and by 2029 the average age is projected at 13.9 years. Trucks have remained relatively unchanged at around 12.1 years, but the average age of cars is now over 14.
Consumers hold on to their cars and trucks longer. Better car and truck reliability and vehicle technology are big reasons for the increasing age of the US car parc. With the slowdown in new vehicle sales in recent years, the age of the average vehicle in the US will continue to creep upwards.
About 92.1% of US households or 120.8 million US households have a car or light truck.
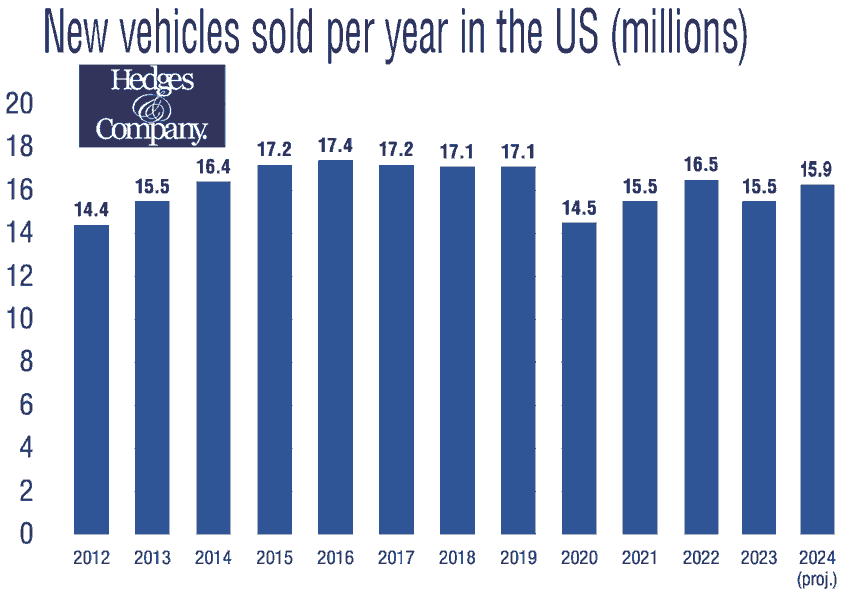
CLICK TO ENLARGE: The number of new vehicles sold are projected at 16.2 million in 2025.
There were about 14.5 million new cars and light-duty trucks sold in 2020 in the US, the lowest number since 2012. (Read our article for a light duty vehicle definition.)
That rebounded in 2021 through 2023 and now just over 16 million new vehicles are projected for 2025 in the US.
Fun fact: the automotive sales figures quoted by the media as car “sales” are actually vehicles shipped by the OEMs. Actual new vehicle sales are determined by vehicle registration data. In a normal year 10% to 20% of vehicles “sold” go into inventory for 30-90 days.
| New cars sold each Year | New Vehicles sold |
|---|---|
| New light vehicles in US 2025 (proj.) | 16.2 million |
| New light vehicles in US 2024 | 15.9 million |
| New light vehicles in US 2023 | 15.5 million |
| New light vehicles in US 2022 | 16.5 million |
| New light vehicles in US 2021 | 15.5 million |
| New light vehicles in US 2020 | 14.5 million |
| New light vehicles in US 2019 | 17.1 million |
| New light vehicles in US 2018 | 17.1 million |
| New light vehicles in US 2017 | 17.2 million |
| New light vehicles in US 2016 | 17.4 million |
| New light vehicles in US 2015 | 17.2 million |
| New light vehicles in US 2014 | 16.4 million |
| New light vehicles in US 2013 | 15.5 million |
| New light vehicles in US 2012 | 14.4 million |
Hedges & Company estimates there are over 8 million motorcycles registered in the United States in 2025.
Here’s a table with other US registration statistics, pulled from vehicle owner databases as well as US government data.
| Number of Registered Vehicles in US | Vehicle Registration Statistics |
|---|---|
| Number of US households with a car or truck, 2023 | 120.8 million (92.1%) |
| Light trucks/SUVs, percentage of total vehicles in US, 2023 | 62% |
| Increase in number of registered vehicles in US 2012-2023 | 17.5% |
| Percentage of alternative fuel vehicles sold in U.S., 2022 | 13% |
| Percentage of alternative fuel vehicles sold in U.S., 2019 | 5% |
| Number of Tesla cars registered in the US (through January 1, 2021) | 827,000 |
| Percentage of Tesla cars in the US, registered, owned and driven in California (through January 1, 2021) | 46% |
| Percentage of registered vehicles in the US that are motorcycles | 3.2% |
| Percentage of registered vehicles in the US that are cars, 2018 | 35% |
| Percentage of diesel vehicles sold in U.S., Q1 2020 | 4% |
| Percentage of 2018 vehicle models that came with 2.0L engine (most popular engine in 2018) | 23% |
| California’s share of all vehicles registered in the US (#1 state with 32.1 million vehicles 2018) | 12% |
| California state-operated vehicle fleet (#1 state for state-operated vehicles) | 38,300 units |
| Wyoming’s share of all vehicles registered in the US (#50 with 593,000 vehicles) | 0.6% |
| Share of top 5 states, all vehicles registered in the US (California, Texas, Florida, New York, and Ohio) | 33.5% |
| Increase in average price of a used vehicle in the US 2009-2010 | 3.8% |
| All U.S. households with one or more leased vehicles | 6% |
| Households with leased vehicles, household income under $25,000 | 4% |
| Households with leased vehicles, household income $25,000 to $50,000 | 5% |
| Households with leased vehicles, household income $50,000 to $100,000 | 10% |
| Households with leased vehicles, household income $100,000 and up | 13% |
| All U.S. households that own one or more vehicles, 2004 | 86.3% |
| All U.S. households that own one or more vehicles, 2007 | 87.0% |
| All U.S. households that rent the home and own one or more vehicles, 2007 | 72.3% |
| All U.S. households that own the home and own one or more vehicles, 2007 | 93.8% |
| Percentage of U.S. households with automotive DIY behavior over a 12 month period | 10% |
| Cars or station wagons in the U.S., percentage of total vehicles, 2010 | 53.4% |
| Sport Utility Vehicles (SUVs) in the U.S., percentage of total vehicles | 12% |
| Minivans, cargo vans and passenger vans in the U.S., percentage of total vehicles | 9% |
| Full size or other trucks in the U.S. with two axles and six or more tires, percentage of total vehicles | 3.2% |
| Decline in new car sales, 2008 vs. 2007 (Great Recession) | -10.5% |
| Decline in domestic new car sales, 2008 vs 2007 (Great Recession) | -13.7% |
| Decline in pickup truck sales, 2008 vs. 2007 (Great Recession) | -27% |
More in-depth vehicle registration statistics are also available from the Bureau of Vehicle Statistics, a section of the Research and Innovative Technology Division (RITA) of the Department of Transportation (DOT). These links open vehicle registration data in a new browser window for your convenience. Also refer to our own auto aftermarket news page for the latest on the automotive aftermarket.
Using custom algorithms, modeling and a variety of data sources, Hedges & Company can create custom data sets forecasting the vehicles that will be on the road. These reports can be customized to include information about the vehicles as well as demographics of their owners. This is available for the US. It covers the entire US as a whole, or in some cases can be broken down by state.
Due to unknown economic and business variables affecting future vehicle sales, we’re not always able to forecast by model. In most cases we can forecast by make, engine platform and drivetrain, or body style.
Contact us for a quote today.

Vehicle registration data is something we’ve analyzed for two decades, but we also feature highly accurate automotive mailing lists.
Click here to learn “what is GVWR?”
Looking for vehicle registration data/Vehicles in Operation (VIO) for foreign or domestic automobile and truck makes? Our vehicle data includes demographic data and ownership data on the following makes: Acura, Audi, Bentley, BMW, Bugatti, Buick, Cadillac, Chevrolet, Chrysler, Daewoo, Dodge, Eagle, Fiat, Ford, Geo, GMC, Honda, Hummer, Hyundai, Infiniti, Isuzu, Jaguar, Jeep, Kia, Lancia, Land Rover, Lexus, Lincoln, Mazda, Mercedes-Benz, Mercury, Merkur, Mini, Mitsubishi, Nissan, Oldsmobile, Plymouth, Pontiac, Ram, Saab, Saturn, Scion, Smart, Subaru, Suzuki, Tesla, Toyota, Volkswagen and Volvo.
There are over 8 million motorcycles registered in the United States. If you need registration statistics for motorcycles, or mailing lists to reach motorcycle owners, we can help. Need mailing list data for motorcycles or ATVs? Motorcycle makes in our masterfile include Aprilia, Big Dog, BMW, Buell, Can-Am, Ducati, Harley-Davidson, Honda, Indian, Kawasaki, KTM, Piaggio, Suzuki, Triumph, Victory and Yamaha.
We have household income, employment, married status, consumer buying histories, primary household language, multiple vehicles owned, and more all by year/make/model.
Need exotic and high-end vehicle data? Our masterfile also includes hard-to-find lists and data on exotic makes like Alfa Romeo, Aston Martin, DeTomaso, Ferrari, Lamborghini, Lotus, Maserati, Maybach, Panoz, Porsche and Rolls Royce.
More information on vehicle registration data and the process it goes through is available in this blog post “Everything You Need to Know About Vehicle Registration Data.” That post covers how the data comes in from DMVs, how the data is cleaned up and standardized, and important ways it is different from vehicle data released by the U.S. government.
Hedges & Company offers a full selection of automotive digital marketing services to put your products in front of those most likely to purchase.
A: Hedges & Company did an analysis in January 2025 and estimates there are 298.7 million registered vehicles in the US, including classic cars, pre-1982 vehicles, and all light, medium and heavy duty vehicles.
A: Hedges & Company estimates 121.6 million US households have a car, which is 92% of all 132.8 million US households in 2025.
A: Hedges & Company estimates 10.4 million US households don’t have a car, which is 8% of all 132.8 million US households in 2025.
A: About 16.2 million new cars and light trucks are projected to be sold in 2025 in the US.
A: Hedges & Company has been tracking statistics on cars and trucks in the US since 2009.