Politics
Charted: Trust in Government Institutions by G7 Countries
![]() See this visualization first on the Voronoi app.
See this visualization first on the Voronoi app.

Trust in Government Institutions by G7 Countries
This was originally posted on our Voronoi app. Download the app for free on iOS or Android and discover incredible data-driven charts from a variety of trusted sources.
How much do you trust the government, and its various institutions?
It’s likely that your level of confidence probably depends on a wide range of factors, such as perceived competency, historical context, economic performance, accountability, social cohesion, and transparency.
And for these same reasons, trust levels in government institutions also change all the time, even in the world’s most developed countries: the G7.
Confidence in Government by G7 Countries (2006-2023)
This chart looks at the changes in trust in government institutions between the years 2006 and 2023, based on data from a multi-country Gallup poll.
Specifically, this dataset aggregates confidence in multiple national institutions, including the military, the judicial system, the national government, and the integrity of the electoral system.
| Country | Confidence (2006) | Confidence (2023) | Change (p.p.) |
|---|---|---|---|
| Canada | 57% | 64% | +7 |
| Britain | 63% | 63% | +0 |
| Germany | 55% | 61% | +6 |
| France | 54% | 60% | +6 |
| Japan | 48% | 59% | +11 |
| Italy | 41% | 54% | +13 |
| United States | 63% | 50% | -13 |
What’s interesting here is that in the G7, a group of the world’s most developed economies, there is only one country bucking the general trend: the United States.
Across most G7 countries, confidence in institutions has either improved or stayed the same between 2006 and 2023. The largest percentage point (p.p.) increases occur in Italy and Japan, which saw +13 p.p. and +11 p.p. increases in trust over the time period.
In the U.S., however, confidence in government institutions has fallen by 13 p.p. over the years. What happened?
Key Figures on U.S. Trust in Institutions
In 2006, the U.S. was tied with the UK as having the highest confidence in government institutions, at 63%.
But here’s where the scores stand in 2023, across various institutions:
| 🇺🇸 Institutions | Confidence (2023) |
|---|---|
| Military | 81% |
| Judiciary | 42% |
| National Government | 30% |
| Elections | 44% |
| Overall | 49% |
Based on this data, it’s clear that the U.S. lags behind in three key indicators: confidence in the national government, confidence in the justice system, and confidence in fair elections. It ranked in last place for each indicator in the G7.
One other data point that stands out: despite leading the world in military spending, the U.S. is only the third most confident in its military in the G7. It lags behind France (86%) and the United Kingdom (83%).


Politics
The Start of De-Dollarization: China’s Gradual Move Away from the USD
The de-dollarization of China’s trade settlements has begun. What patterns do we see in USD and RMB use within China and globally?


The Start of De-Dollarization: China’s Move Away from the USD
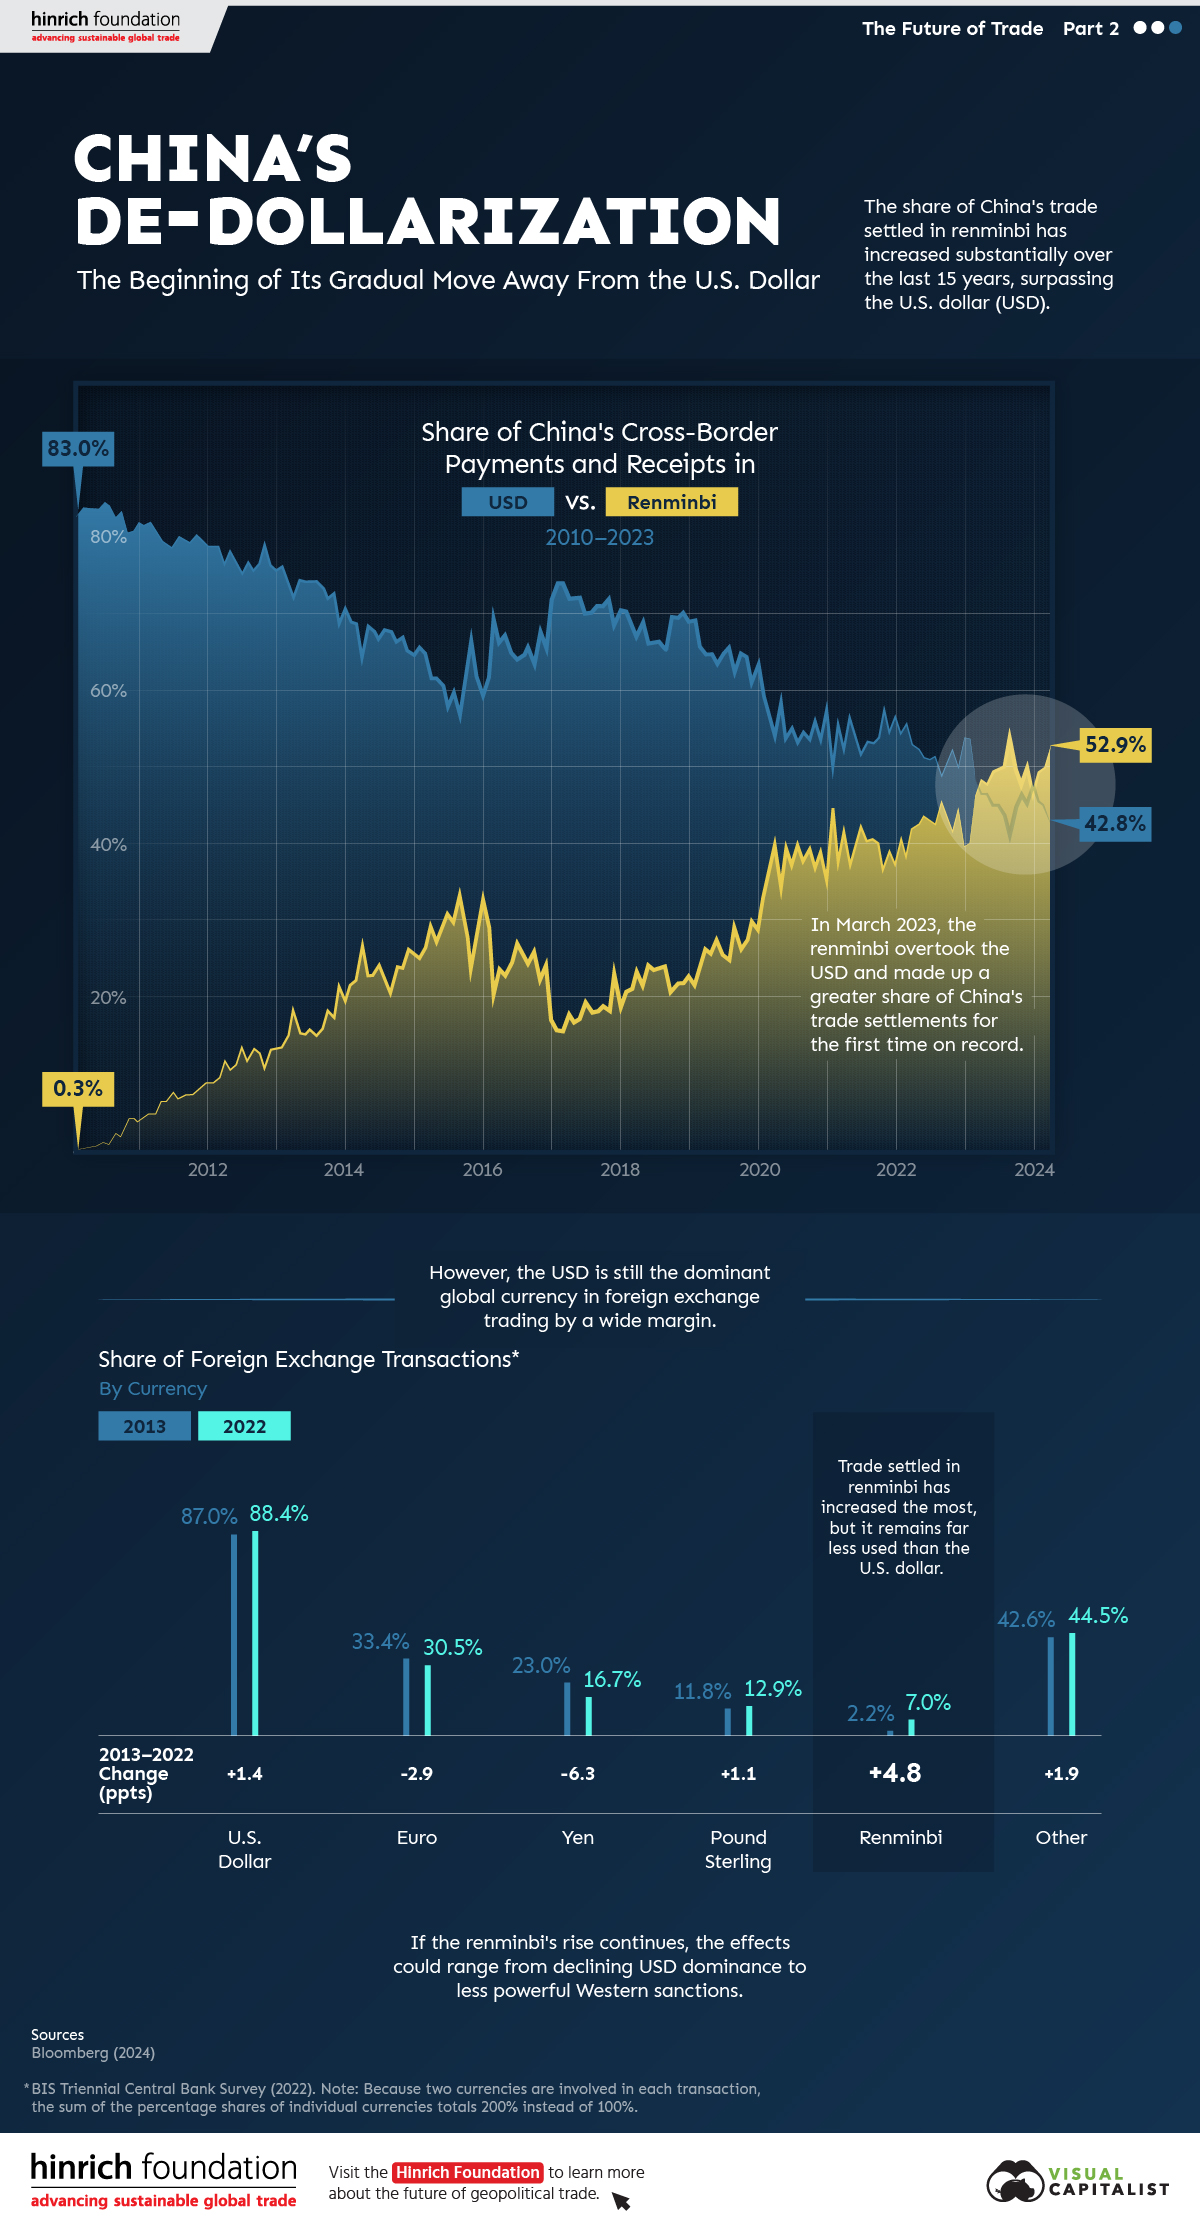
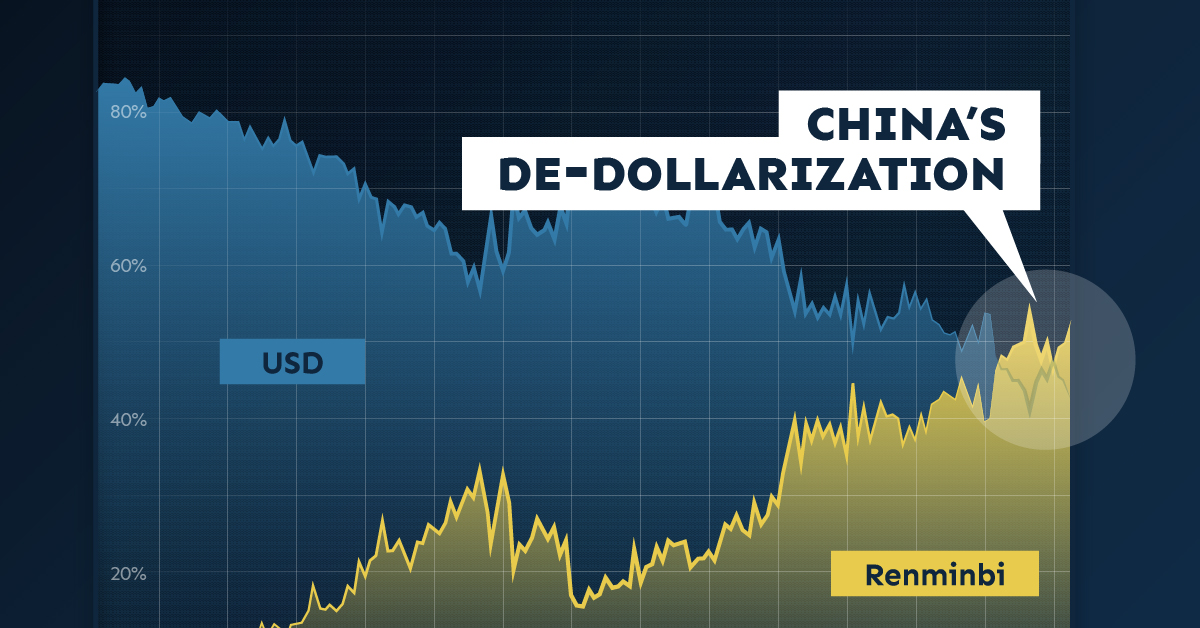
Since 2010, the majority of China’s cross-border payments, like those of many countries, have been settled in U.S. dollars (USD). As of the first quarter of 2023, that’s no longer the case.
This graphic from the Hinrich Foundation, the second in a three-part series covering the future of trade, provides visual context to the growing use of the Chinese renminbi (RMB) in payments both domestically and globally.
The De-Dollarization of China’s Cross-Border Transactions
This analysis uses Bloomberg data on the share of China’s payments and receipts in RMB, USD, and other currencies from 2010 to 2024.
In the first few months of 2010, settlements in local currency accounted for less than 1.0% of China’s cross-border payments, compared to approximately 83.0% in USD.
China has since closed that gap. In March 2023, the share of the RMB in China’s settlements surpassed the USD for the first time.
| Date | Renminbi | U.S. Dollar | Other |
|---|---|---|---|
| March 2010 | 0.3% | 84.3% | 15.4% |
| March 2011 | 4.8% | 81.3% | 13.9% |
| March 2012 | 11.5% | 77.1% | 11.5% |
| March 2013 | 18.1% | 72.7% | 9.2% |
| March 2014 | 26.6% | 64.8% | 8.6% |
| March 2015 | 29.0% | 61.9% | 9.0% |
| March 2016 | 23.6% | 66.7% | 9.7% |
| March 2017 | 17.6% | 72.5% | 9.9% |
| March 2018 | 23.2% | 67.4% | 9.4% |
| March 2019 | 26.2% | 65.1% | 8.7% |
| March 2020 | 39.3% | 54.4% | 6.3% |
| March 2021 | 41.7% | 52.6% | 5.6% |
| March 2022 | 42.1% | 53.3% | 4.7% |
| March 2023 | 48.4% | 46.7% | 4.9% |
| March 2024 | 52.9% | 42.8% | 4.3% |
Source: Bloomberg (2024)
Since then, the de-dollarization in Chinese international settlements has continued.
As of March 2024, over half (52.9%) of Chinese payments were settled in RMB while 42.8% were settled in USD. This is double the share from five years previous. According to Goldman Sachs, foreigners’ increased willingness to trade assets denominated in RMB significantly contributed to de-dollarization in favor of China’s currency. Also, early last year, Brazil and Argentina announced that they would begin allowing trade settlements in RMB.
Most Popular Currencies in Foreign Exchange (FX) Transactions
Globally, analysis from the Bank for International Settlements reveals that, in 2022, the USD remained the most-used currency for FX settlements. The euro and the Japanese yen came in second and third, respectively.
| Currency | 2013 | 2022 | Change (pp) |
|---|---|---|---|
| U.S. Dollar | 87.0% | 88.5% | +1.5 |
| Euro | 33.4% | 30.5% | -2.9 |
| Yen | 23.0% | 16.7% | -6.3 |
| Pound Sterling | 11.8% | 12.9% | +1.1 |
| Renminbi | 2.2% | 7.0% | +4.8 |
| Other | 42.6% | 44.4% | +1.8 |
| Total | 200.0% | 200.0% |
Source: BIS Triennial Central Bank Survey (2022). Because two currencies are involved in each transaction, the sum of the percentage shares of individual currencies totals 200% instead of 100%.
The Chinese renminbi, though accounting for a relatively small share of FX transactions, gained the most ground over the last decade. Meanwhile, the euro and the yen saw decreases in use.
The Future of De-Dollarization
If the RMB’s global rise continues, the stranglehold of the USD on international trade could diminish over time.
The impacts of declining dollar dominance are complex and uncertain, but they could range from the underperformance of U.S. financial assets to diminished power of Western sanctions.
However, though the prevalence of RMB in international payments could rise, a complete de-dollarization of the world economy in the near- or medium-term is unlikely. China’s strict capital controls that limit the availability of RMB outside the country, and the nation’s sputtering economic growth, are key reasons contributing to this.
The third piece in this series will explore Russia’s shifting trading patterns following its invasion of Ukraine.
Visit the Hinrich Foundation to learn more about the future of geopolitical trade

-

 Politics2 weeks ago
Which Countries Have the Most Economic Influence in Southeast Asia?
One country dominates this survey of who has the most economic influence in the region.
-

 Public Opinion2 weeks ago
Charted: How Democrats and Republicans View Government Agencies
Predictably, results diverge when both Democrats and Republicans are asked to rate key government agencies in the United States.
-

 War3 weeks ago
Visualized: Aircraft Carriers by Country
The U.S. controls 40% of global aircraft carrier fleet.
-

 Public Opinion3 weeks ago
Charted: How Americans Feel About Federal Government Agencies
Fourteen of 16 federal government agencies garnered more favorable responses than unfavorable ones. But what were the outliers?
-

 United States4 weeks ago
Charted: What Southeast Asia Thinks About China & the U.S.
A significant share of respondents from an ASEAN-focused survey are not happy about rising American and Chinese influence in the region.
-

 Politics1 month ago
Charted: Trust in Government Institutions by G7 Countries
How much do you trust the government and its various institutions? We look at data for G7 countries for the time period of 2006-2023.

-

 Energy1 week ago
Ranked: The World’s Largest Lithium Producers in 2023
-
Public Opinion2 weeks ago
Charted: How Democrats and Republicans View Government Agencies
-

 Globalization2 weeks ago
Mapped: The Top Exports in Asian Countries
-

 Venture Capital2 weeks ago
Ranked: The World’s 50 Largest Private Equity Firms
-

 United States2 weeks ago
Mapped: The 10 U.S. States With the Lowest Real GDP Growth
-

 China2 weeks ago
Comparing New and Current U.S. Tariffs on Chinese Imports
-
Politics2 weeks ago
Which Countries Have the Most Economic Influence in Southeast Asia?
-

 Misc2 weeks ago
The Top 25 Nationalities of U.S. Immigrants