Every two years, communities receiving federal funding for homelessness services conduct a Point-in-Time (PIT) Count of people experiencing homelessness. The PIT Count is the primary source of nationwide data on homelessness.
PIT Counts collect information on people in emergency shelters and transitional housing (the sheltered count). PIT Counts also collect information about people sleeping on the streets, in cars, on abandoned properties, or on other places not meant for human habitation (the unsheltered count).
- The PIT Count improves our understanding about the size and characteristics of our homeless population, which informs strategic planning.
- The PIT Count results also impact our funding.
Scroll down for information about the 2024 Point-in-Time Count.
2024 Point-in-Time Count
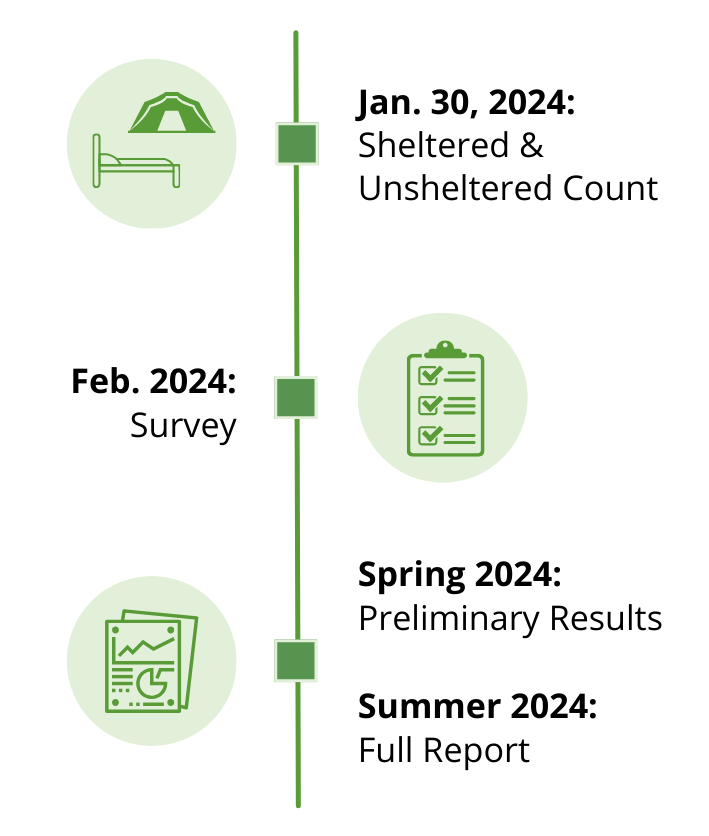
The 2024 Point-in-Time Count took place on January 30, 2024.
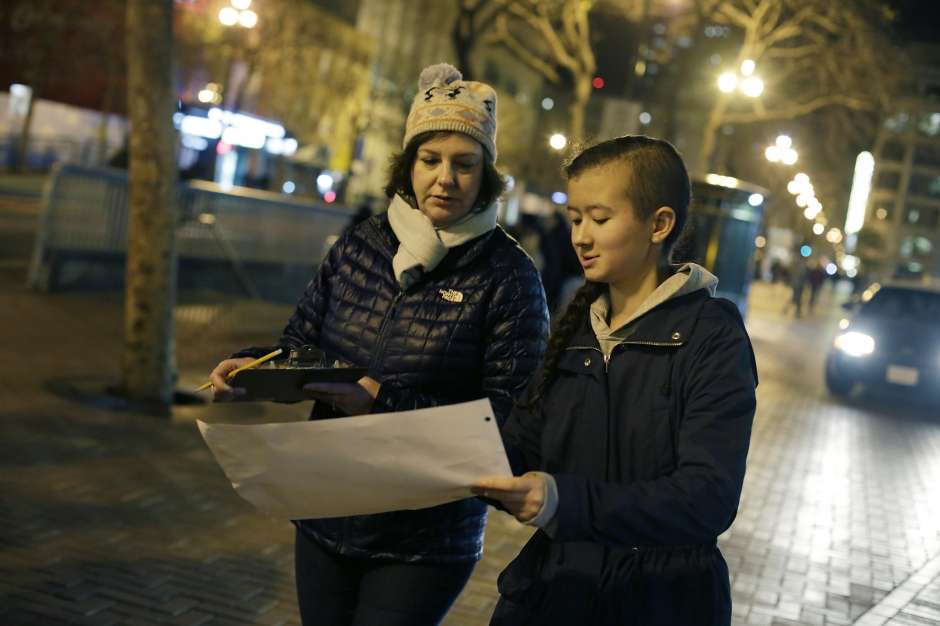
That night, teams of skilled outreach workers and volunteers walked or drove routes covering the entire city of San Francisco to count the number of people experiencing unsheltered homelessness. We also counted the number of people staying in shelters and transitional housing.
In February, we administer a survey to get more information about people experiencing homelessness in San Francisco, including demographic information.
Below is preliminary data gathered during the 2024 count. The full report will be released in summer 2024.
Preliminary 2024 Point-in-Time Count Data
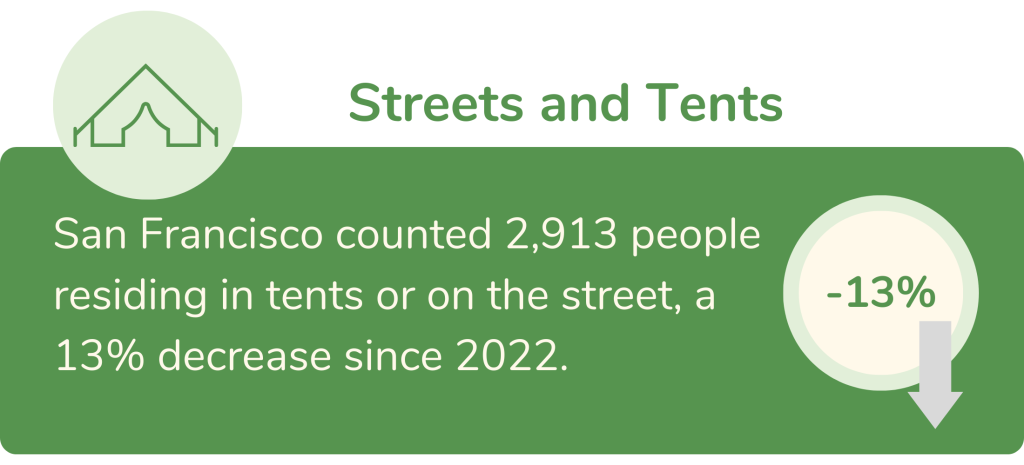
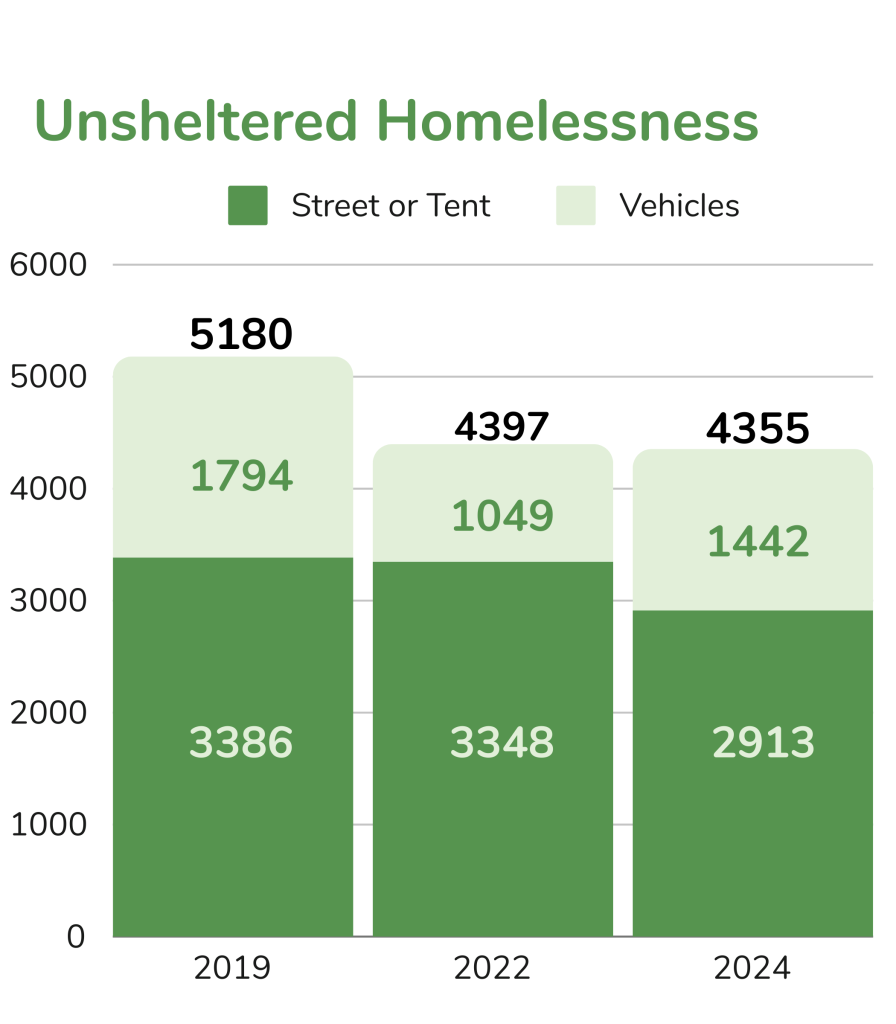
The 2024 PIT Count found that 13% fewer people were sleeping on the streets or in tents than in 2022, the lowest it has been in ten years.
4,355 unsheltered people were counted, a 1% decrease since 2022 and a 16% decrease since 2019.
The number of people living in vehicles increased 37% from 2022, but decreased 20% since 2019.
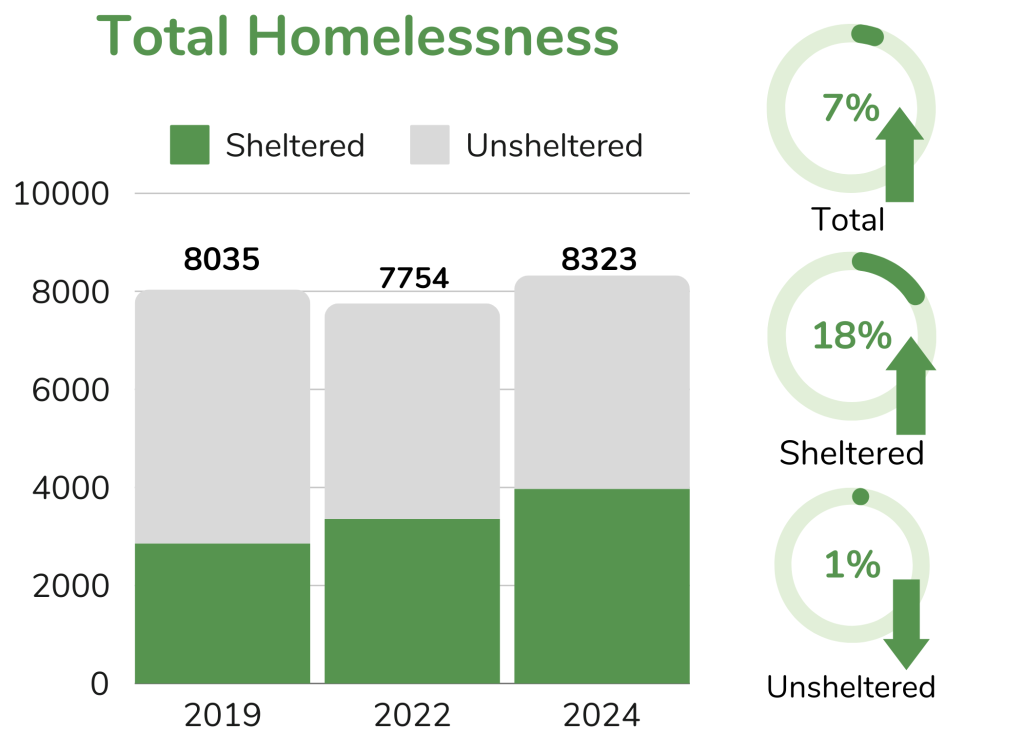
Total homelessness (combining sheltered and unsheltered people) increased by 7% since 2022 from 7,754 to 8,323.
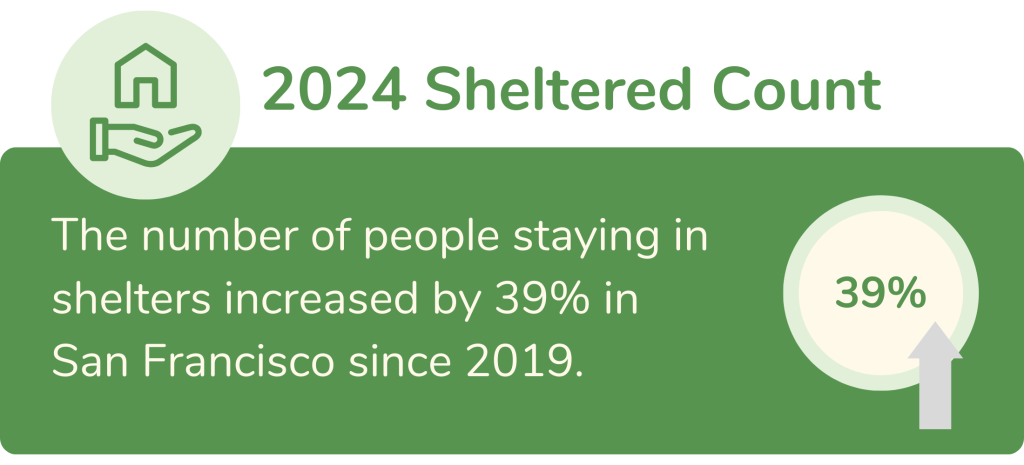
3,969 people were living in shelters the night of the 2024 PIT Count. This is a 39% increase since 2019.
This corresponds with a 28% increase in available shelter beds since 2019.
More people experiencing homelessness in San Francisco are in shelter than ever before.

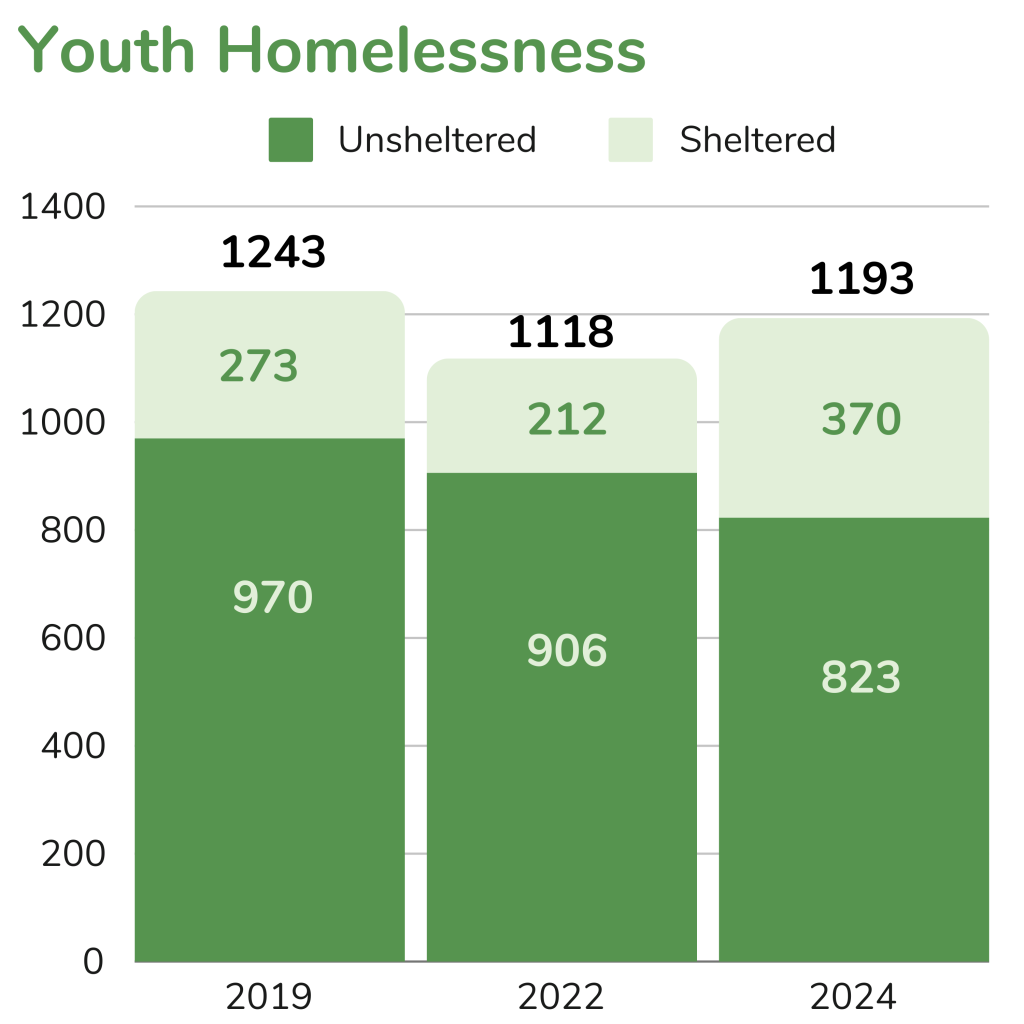
The unsheltered homeless youth (unaccompanied minors and young adults age 24 and younger) population decreased 9% between 2022 and 2024.
The number of sheltered homeless youth increased 87% between 2022 and 2024.
New targeted efforts to better identify homeless families were introduced in 2024. 437 homeless families were counted, a significant increase from prior years.
143 families were experiencing unsheltered homelessness, 90% of whom were found to be sleeping in vehicles.
The total number of homeless veterans decreased by 3%, with 605 homeless veterans in 2022 and 587 homeless veterans in 2024.


Between 2022 and 2024, chronic homelessness increased by 9% with 2,928 people experiencing chronic homelessness in 2024.
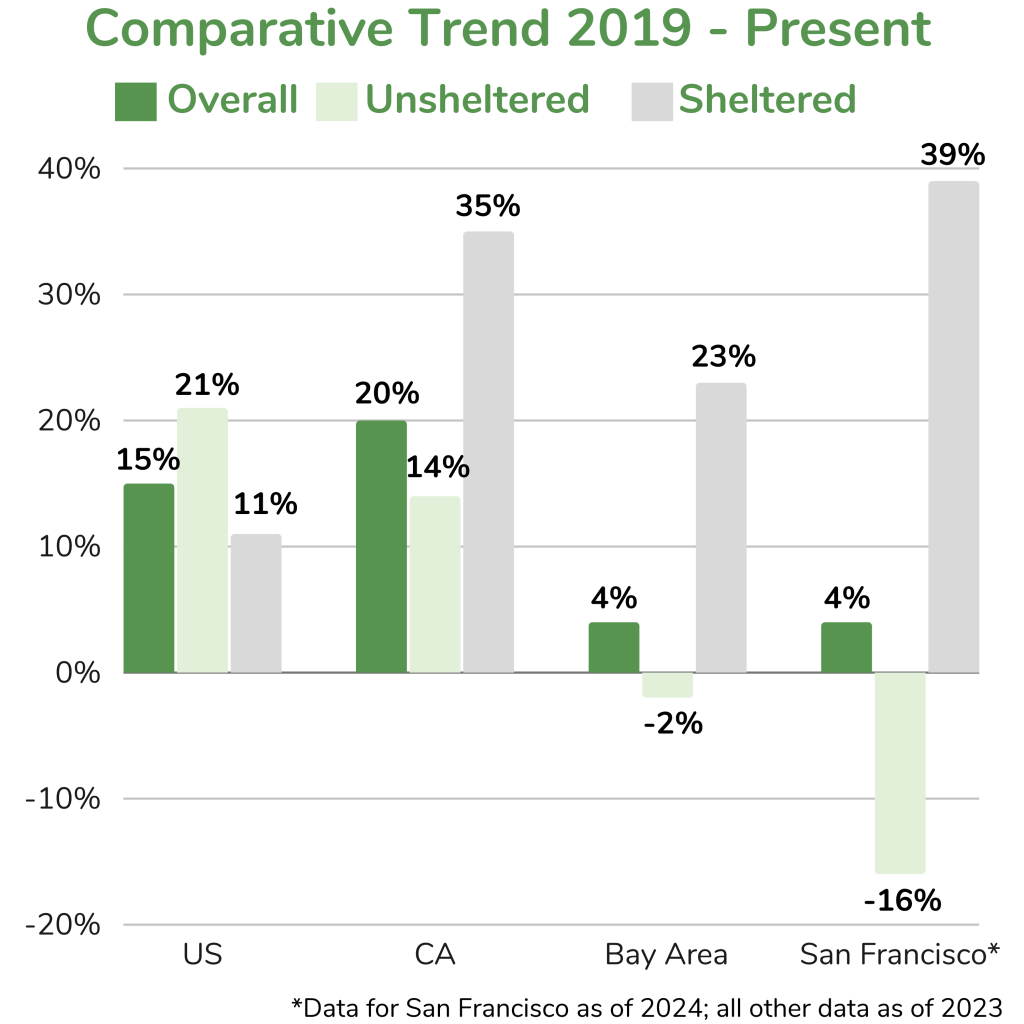
The 2024 PIT results show a modest increase since 2022 in homelessness in San Francisco. This increase is better than national trends in overall homelessness. Between 2019-2023, there was a 15% increase in homelessness nationally.