Markets
Visualizing $97 Trillion of Global Debt in 2023
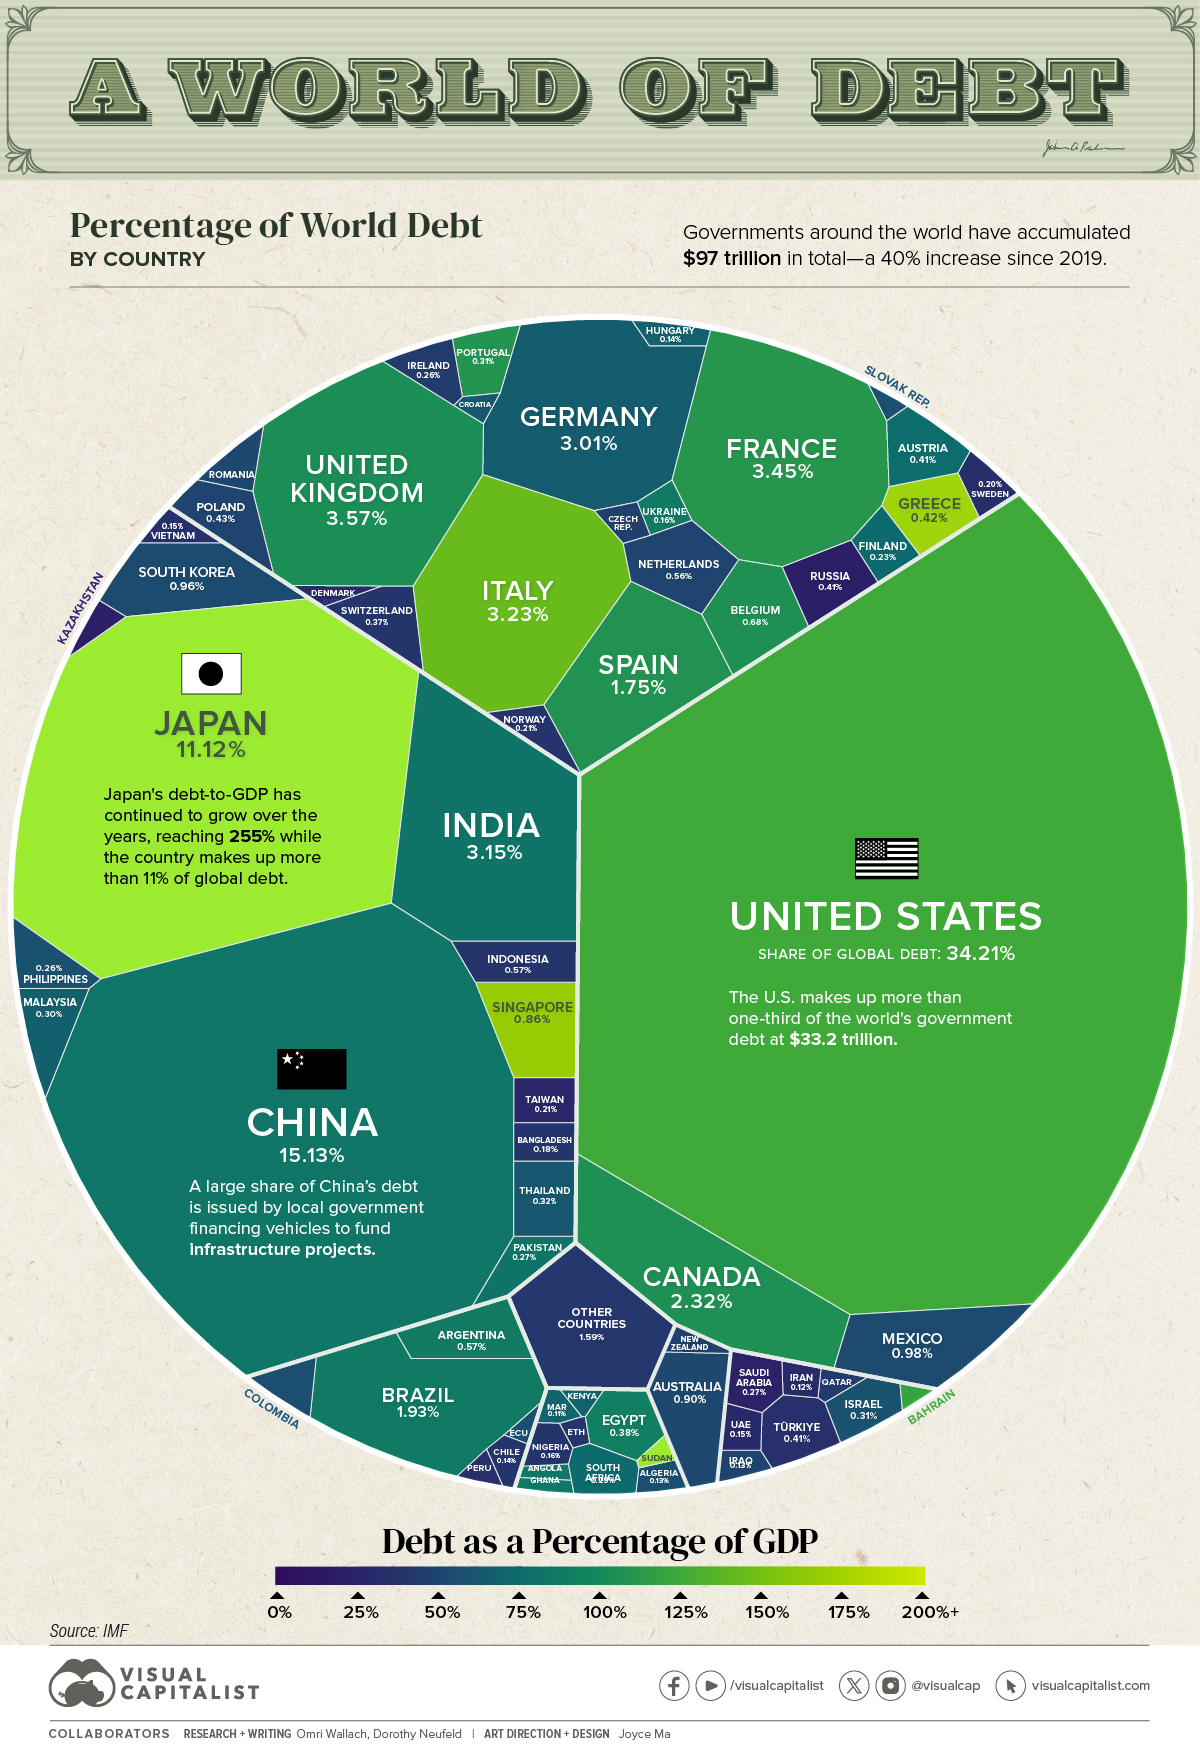


Visualizing $97 Trillion of Government Debt in 2023
Global government debt is projected to hit $97.1 trillion this year, a 40% increase since 2019.
During the COVID-19 pandemic, governments introduced sweeping financial measures to support the job market and prevent a wave of bankruptcies. However, this has exposed vulnerabilities as higher interest rates are amplifying borrowing costs.
This graphic shows global debt by country in 2023, based on projections from the International Monetary Fund (IMF).
Debt by Country in 2023
Below, we rank countries by their general government gross debt, or the financial liabilities owed by each country:
| Country | Gross Debt (B) | % of World Total | Debt to GDP |
|---|---|---|---|
| 🇺🇸 U.S. | $33,228.9 | 34.2% | 123.3% |
| 🇨🇳 China | $14,691.7 | 15.1% | 83.0% |
| 🇯🇵 Japan | $10,797.2 | 11.1% | 255.2% |
| 🇬🇧 UK | $3,468.7 | 3.6% | 104.1% |
| 🇫🇷 France | $3,353.9 | 3.5% | 110.0% |
| 🇮🇹 Italy | $3,141.4 | 3.2% | 143.7% |
| 🇮🇳 India | $3,056.7 | 3.1% | 81.9% |
| 🇩🇪 Germany | $2,919.3 | 3.0% | 65.9% |
| 🇨🇦 Canada | $2,253.3 | 2.3% | 106.4% |
| 🇧🇷 Brazil | $1,873.7 | 1.9% | 88.1% |
| 🇪🇸 Spain | $1,697.5 | 1.7% | 107.3% |
| 🇲🇽 Mexico | $954.6 | 1.0% | 52.7% |
| 🇰🇷 South Korea | $928.1 | 1.0% | 54.3% |
| 🇦🇺 Australia | $875.9 | 0.9% | 51.9% |
| 🇸🇬 Singapore | $835.0 | 0.9% | 167.9% |
| 🇧🇪 Belgium | $665.2 | 0.7% | 106.0% |
| 🇦🇷 Argentina | $556.5 | 0.6% | 89.5% |
| 🇮🇩 Indonesia | $552.8 | 0.6% | 39.0% |
| 🇳🇱 Netherlands | $540.9 | 0.6% | 49.5% |
| 🇵🇱 Poland | $419.4 | 0.4% | 49.8% |
| 🇬🇷 Greece | $407.2 | 0.4% | 168.0% |
| 🇹🇷 Türkiye | $397.2 | 0.4% | 34.4% |
| 🇷🇺 Russia | $394.8 | 0.4% | 21.2% |
| 🇦🇹 Austria | $393.6 | 0.4% | 74.8% |
| 🇪🇬 Egypt | $369.3 | 0.4% | 92.7% |
| 🇨🇭 Switzerland | $357.7 | 0.4% | 39.5% |
| 🇹🇭 Thailand | $314.5 | 0.3% | 61.4% |
| 🇮🇱 Israel | $303.6 | 0.3% | 58.2% |
| 🇵🇹 Portugal | $299.4 | 0.3% | 108.3% |
| 🇲🇾 Malaysia | $288.3 | 0.3% | 66.9% |
| 🇿🇦 South Africa | $280.7 | 0.3% | 73.7% |
| 🇵🇰 Pakistan | $260.9 | 0.3% | 76.6% |
| 🇸🇦 Saudi Arabia | $257.7 | 0.3% | 24.1% |
| 🇮🇪 Ireland | $251.7 | 0.3% | 42.7% |
| 🇵🇭 Philippines | $250.9 | 0.3% | 57.6% |
| 🇫🇮 Finland | $225.0 | 0.2% | 73.6% |
| 🇳🇴 Norway | $204.5 | 0.2% | 37.4% |
| 🇨🇴 Colombia | $200.1 | 0.2% | 55.0% |
| 🇹🇼 Taiwan | $200.0 | 0.2% | 26.6% |
| 🇸🇪 Sweden | $192.9 | 0.2% | 32.3% |
| 🇷🇴 Romania | $178.7 | 0.2% | 51.0% |
| 🇧🇩 Bangladesh | $175.9 | 0.2% | 39.4% |
| 🇺🇦 Ukraine | $152.8 | 0.2% | 88.1% |
| 🇨🇿 Czech Republic | $152.2 | 0.2% | 45.4% |
| 🇳🇬 Nigeria | $151.3 | 0.2% | 38.8% |
| 🇦🇪 UAE | $149.7 | 0.2% | 29.4% |
| 🇻🇳 Vietnam | $147.3 | 0.2% | 34.0% |
| 🇭🇺 Hungary | $140.0 | 0.1% | 68.7% |
| 🇨🇱 Chile | $132.2 | 0.1% | 38.4% |
| 🇩🇰 Denmark | $126.7 | 0.1% | 30.1% |
| 🇮🇶 Iraq | $125.5 | 0.1% | 49.2% |
| 🇩🇿 Algeria | $123.5 | 0.1% | 55.1% |
| 🇳🇿 New Zealand | $115.0 | 0.1% | 46.1% |
| 🇮🇷 Iran | $112.1 | 0.1% | 30.6% |
| 🇲🇦 Morocco | $102.7 | 0.1% | 69.7% |
| 🇶🇦 Qatar | $97.5 | 0.1% | 41.4% |
| 🇵🇪 Peru | $89.7 | 0.1% | 33.9% |
| 🇦🇴 Angola | $79.6 | 0.1% | 84.9% |
| 🇰🇪 Kenya | $79.1 | 0.1% | 70.2% |
| 🇸🇰 Slovakia | $75.4 | 0.1% | 56.7% |
| 🇩🇴 Dominican Republic | $72.1 | 0.1% | 59.8% |
| 🇪🇨 Ecuador | $65.9 | 0.1% | 55.5% |
| 🇸🇩 Sudan | $65.5 | 0.1% | 256.0% |
| 🇬🇭 Ghana | $65.1 | 0.1% | 84.9% |
| 🇰🇿 Kazakhstan | $60.7 | 0.1% | 23.4% |
| 🇪🇹 Ethiopia | $59.0 | 0.1% | 37.9% |
| 🇧🇭 Bahrain | $54.5 | 0.1% | 121.2% |
| 🇨🇷 Costa Rica | $53.9 | 0.1% | 63.0% |
| 🇭🇷 Croatia | $51.2 | 0.1% | 63.8% |
| 🇺🇾 Uruguay | $47.0 | 0.0% | 61.6% |
| 🇯🇴 Jordan | $46.9 | 0.0% | 93.8% |
| 🇸🇮 Slovenia | $46.8 | 0.0% | 68.5% |
| 🇨🇮 Côte d'Ivoire | $45.1 | 0.0% | 56.8% |
| 🇵🇦 Panama | $43.5 | 0.0% | 52.8% |
| 🇲🇲 Myanmar | $43.0 | 0.0% | 57.5% |
| 🇴🇲 Oman | $41.4 | 0.0% | 38.2% |
| 🇹🇳 Tunisia | $39.9 | 0.0% | 77.8% |
| 🇷🇸 Serbia | $38.5 | 0.0% | 51.3% |
| 🇧🇴 Bolivia | $37.8 | 0.0% | 80.8% |
| 🇹🇿 Tanzania | $35.8 | 0.0% | 42.6% |
| 🇺🇿 Uzbekistan | $31.7 | 0.0% | 35.1% |
| 🇿🇼 Zimbabwe | $30.9 | 0.0% | 95.4% |
| 🇧🇾 Belarus | $30.4 | 0.0% | 44.1% |
| 🇬🇹 Guatemala | $29.1 | 0.0% | 28.3% |
| 🇱🇹 Lithuania | $28.7 | 0.0% | 36.1% |
| 🇸🇻 El Salvador | $25.8 | 0.0% | 73.0% |
| 🇺🇬 Uganda | $25.3 | 0.0% | 48.3% |
| 🇸🇳 Senegal | $25.2 | 0.0% | 81.0% |
| 🇨🇾 Cyprus | $25.2 | 0.0% | 78.6% |
| 🇱🇺 Luxembourg | $24.6 | 0.0% | 27.6% |
| 🇭🇰 Hong Kong SAR | $23.5 | 0.0% | 6.1% |
| 🇧🇬 Bulgaria | $21.7 | 0.0% | 21.0% |
| 🇨🇲 Cameroon | $20.6 | 0.0% | 41.9% |
| 🇲🇿 Mozambique | $19.7 | 0.0% | 89.7% |
| 🇵🇷 Puerto Rico | $19.6 | 0.0% | 16.7% |
| 🇳🇵 Nepal | $19.3 | 0.0% | 46.7% |
| 🇱🇻 Latvia | $18.9 | 0.0% | 40.6% |
| 🇮🇸 Iceland | $18.7 | 0.0% | 61.2% |
| 🇵🇾 Paraguay | $18.1 | 0.0% | 40.9% |
| 🇱🇦 Lao P.D.R. | $17.3 | 0.0% | 121.7% |
| 🇭🇳 Honduras | $15.7 | 0.0% | 46.3% |
| 🇵🇬 Papua New Guinea | $15.7 | 0.0% | 49.5% |
| 🇹🇹 Trinidad and Tobago | $14.6 | 0.0% | 52.5% |
| 🇦🇱 Albania | $14.5 | 0.0% | 62.9% |
| 🇨🇬 Republic of Congo | $14.1 | 0.0% | 97.8% |
| 🇦🇿 Azerbaijan | $14.1 | 0.0% | 18.2% |
| 🇾🇪 Yemen | $14.0 | 0.0% | 66.4% |
| 🇯🇲 Jamaica | $13.6 | 0.0% | 72.3% |
| 🇲🇳 Mongolia | $13.1 | 0.0% | 69.9% |
| 🇧🇫 Burkina Faso | $12.7 | 0.0% | 61.2% |
| 🇬🇦 Gabon | $12.5 | 0.0% | 64.9% |
| 🇬🇪 Georgia | $11.9 | 0.0% | 39.6% |
| 🇲🇺 Mauritius | $11.8 | 0.0% | 79.7% |
| 🇦🇲 Armenia | $11.8 | 0.0% | 47.9% |
| 🇧🇸 Bahamas | $11.7 | 0.0% | 84.2% |
| 🇲🇱 Mali | $11.0 | 0.0% | 51.8% |
| 🇲🇹 Malta | $11.0 | 0.0% | 54.1% |
| 🇰🇭 Cambodia | $10.9 | 0.0% | 35.3% |
| 🇧🇯 Benin | $10.6 | 0.0% | 53.0% |
| 🇲🇼 Malawi | $10.4 | 0.0% | 78.6% |
| 🇪🇪 Estonia | $9.0 | 0.0% | 21.6% |
| 🇨🇩 Democratic Republic of Congo | $9.0 | 0.0% | 13.3% |
| 🇷🇼 Rwanda | $8.8 | 0.0% | 63.3% |
| 🇳🇦 Namibia | $8.5 | 0.0% | 67.6% |
| 🇲🇬 Madagascar | $8.5 | 0.0% | 54.0% |
| 🇳🇪 Niger | $8.3 | 0.0% | 48.7% |
| 🇲🇰 North Macedonia | $8.2 | 0.0% | 51.6% |
| 🇧🇦 Bosnia and Herzegovina | $7.7 | 0.0% | 28.6% |
| 🇲🇻 Maldives | $7.7 | 0.0% | 110.3% |
| 🇬🇳 Guinea | $7.3 | 0.0% | 31.6% |
| 🇳🇮 Nicaragua | $7.2 | 0.0% | 41.5% |
| 🇧🇧 Barbados | $7.2 | 0.0% | 115.0% |
| 🇹🇬 Togo | $6.1 | 0.0% | 67.2% |
| 🇰🇬 Kyrgyz Republic | $6.0 | 0.0% | 47.0% |
| 🇲🇩 Moldova | $5.6 | 0.0% | 35.1% |
| 🇹🇩 Chad | $5.4 | 0.0% | 43.2% |
| 🇰🇼 Kuwait | $5.4 | 0.0% | 3.4% |
| 🇲🇷 Mauritania | $5.1 | 0.0% | 49.5% |
| 🇭🇹 Haiti | $5.1 | 0.0% | 19.6% |
| 🇬🇾 Guyana | $4.9 | 0.0% | 29.9% |
| 🇲🇪 Montenegro | $4.6 | 0.0% | 65.8% |
| 🇫🇯 Fiji | $4.6 | 0.0% | 83.6% |
| 🇹🇲 Turkmenistan | $4.2 | 0.0% | 5.1% |
| 🇹🇯 Tajikistan | $4.0 | 0.0% | 33.5% |
| 🇧🇼 Botswana | $3.9 | 0.0% | 18.7% |
| 🇬🇶 Equatorial Guinea | $3.8 | 0.0% | 38.3% |
| 🇸🇷 Suriname | $3.8 | 0.0% | 107.0% |
| 🇸🇸 South Sudan | $3.8 | 0.0% | 60.4% |
| 🇧🇹 Bhutan | $3.3 | 0.0% | 123.4% |
| 🇦🇼 Aruba | $3.2 | 0.0% | 82.9% |
| 🇸🇱 Sierra Leone | $3.1 | 0.0% | 88.9% |
| 🇨🇻 Cabo Verde | $2.9 | 0.0% | 113.1% |
| 🇧🇮 Burundi | $2.3 | 0.0% | 72.7% |
| 🇱🇷 Liberia | $2.3 | 0.0% | 52.3% |
| 🇽🇰 Kosovo | $2.2 | 0.0% | 21.3% |
| 🇸🇿 Eswatini | $2.0 | 0.0% | 42.4% |
| 🇧🇿 Belize | $1.9 | 0.0% | 59.3% |
| 🇱🇨 Saint Lucia | $1.8 | 0.0% | 74.2% |
| 🇬🇲 Gambia | $1.7 | 0.0% | 72.3% |
| 🇩🇯 Djibouti | $1.6 | 0.0% | 41.8% |
| 🇦🇬 Antigua and Barbuda | $1.6 | 0.0% | 80.5% |
| 🇸🇲 San Marino | $1.5 | 0.0% | 74.0% |
| 🇬🇼 Guinea-Bissau | $1.5 | 0.0% | 73.9% |
| 🇱🇸 Lesotho | $1.5 | 0.0% | 61.3% |
| 🇦🇩 Andorra | $1.4 | 0.0% | 37.7% |
| 🇨🇫 Central African Republic | $1.4 | 0.0% | 50.1% |
| 🇸🇨 Seychelles | $1.3 | 0.0% | 60.8% |
| 🇻🇨 Saint Vincent and the Grenadines | $0.9 | 0.0% | 86.2% |
| 🇬🇩 Grenada | $0.8 | 0.0% | 60.2% |
| 🇩🇲 Dominica | $0.7 | 0.0% | 93.9% |
| 🇰🇳 Saint Kitts and Nevis | $0.6 | 0.0% | 53.2% |
| 🇻🇺 Vanuatu | $0.5 | 0.0% | 46.8% |
| 🇰🇲 Comoros | $0.5 | 0.0% | 33.3% |
| 🇸🇹 São Tomé and Príncipe | $0.4 | 0.0% | 58.5% |
| 🇸🇧 Solomon Islands | $0.4 | 0.0% | 22.2% |
| 🇧🇳 Brunei Darussalam | $0.3 | 0.0% | 2.3% |
| 🇼🇸 Samoa | $0.3 | 0.0% | 36.2% |
| 🇹🇱 Timor-Leste | $0.3 | 0.0% | 16.4% |
| 🇵🇼 Palau | $0.2 | 0.0% | 85.4% |
| 🇹🇴 Tonga | $0.2 | 0.0% | 41.1% |
| 🇫🇲 Micronesia | $0.1 | 0.0% | 12.5% |
| 🇲🇭 Marshall Islands | $0.1 | 0.0% | 18.1% |
| 🇳🇷 Nauru | <$0.1 | 0.0% | 29.1% |
| 🇰🇮 Kiribati | <$0.1 | 0.0% | 13.1% |
| 🇹🇻 Tuvalu | <$0.1 | 0.0% | 8.0% |
| 🇲🇴 Macao SAR | <$0.1 | 0.0% | 0.0% |
| 🌐 World | $97,129.8 | 100% | 93.0% |
With $33.2 trillion in government debt, the U.S. makes up over a third of the world total.
Given the increasing debt load, the cost of servicing this debt now accounts for 20% of government spending. It is projected to reach $1 trillion by 2028, surpassing the total spent on defense.
The world’s third-biggest economy, Japan, has one of the highest debt to GDP ratios, at 255%. Over the last two decades, its national debt has far exceeded 100% of its GDP, driven by an aging population and social security expenses.
In 2023, Egypt faces steep borrowing costs, with 40% of revenues going towards debt repayments. It has the highest debt on the continent.
Like Egypt, several emerging economies are facing strain. Lebanon has been in default since 2020, and Ghana defaulted on the majority of its external debt—debt owed to foreign lenders—in 2022 amid a deepening economic crisis.
Global Debt: A Regional Perspective
How does debt compare on a regional level in 2023?
| Region | Gross Debt (B) | % of World Total | Debt to GDP |
|---|---|---|---|
| North America | $36,451.8 | 37.5% | 117.6% |
| Asia and Pacific | $34,257.4 | 35.3% | 92.5% |
| Europe | $20,123.4 | 20.7% | 79.1% |
| South America | $3,164.9 | 3.3% | 77.2% |
| Africa | $1,863.6 | 1.9% | 65.2% |
| Other/Rest of World | $1,269.1 | 1.3% | 31.4% |
We can see that North America has both the highest debt and debt to GDP compared to other regions. Just as U.S. debt has ballooned, so has Canada’s—ranking as the 10th-highest globally in government debt outstanding.
Across Asia and the Pacific, debt levels hover close to North America.
At 3.3% of the global total, South America has $3.2 trillion in debt. As inflation has trended downwards, a handful of governments have already begun cutting interest rates. Overall, public debt levels are projected to stay elevated across the region.
Debt levels have also risen rapidly in Africa, with an average 40% of public debt held in foreign currencies—leaving it exposed to exchange rate fluctuations. Another challenge is that interest rates are also higher across the region compared to advanced economies, increasing debt-servicing costs.
By 2028, the IMF projects that global public debt will exceed 100% of GDP, hitting levels only seen during the pandemic.


Maps
Mapped: The 10 U.S. States With the Lowest Real GDP Growth
In this graphic, we show where real GDP lagged the most across America in 2023 as high interest rates weighed on state economies.


The Top 10 U.S. States, by Lowest Real GDP Growth
This was originally posted on our Voronoi app. Download the app for free on iOS or Android and discover incredible data-driven charts from a variety of trusted sources.
While the U.S. economy defied expectations in 2023, posting 2.5% in real GDP growth, several states lagged behind.
Last year, oil-producing states led the pack in terms of real GDP growth across America, while the lowest growth was seen in states that were more sensitive to the impact of high interest rates, particularly due to slowdowns in the manufacturing and finance sectors.
This graphic shows the 10 states with the least robust real GDP growth in 2023, based on data from the Bureau of Economic Analysis.
Weakest State Economies in 2023
Below, we show the states with the slowest economic activity in inflation-adjusted terms, using chained 2017 dollars:
| Rank | State | Real GDP Growth 2023 YoY | Real GDP 2023 |
|---|---|---|---|
| 1 | Delaware | -1.2% | $74B |
| 2 | Wisconsin | +0.2% | $337B |
| 3 | New York | +0.7% | $1.8T |
| 4 | Missississippi | +0.7% | $115B |
| 5 | Georgia | +0.8% | $661B |
| 6 | Minnesota | +1.2% | $384B |
| 7 | New Hampshire | +1.2% | $91B |
| 8 | Ohio | +1.2% | $698B |
| 9 | Iowa | +1.3% | $200B |
| 10 | Illinois | +1.3% | $876B |
| U.S. | +2.5% | $22.4T |
Delaware witnessed the slowest growth in the country, with real GDP growth of -1.2% over the year as a sluggish finance and insurance sector dampened the state’s economy.
Like Delaware, the Midwestern state of Wisconsin also experienced declines across the finance and insurance sector, in addition to steep drops in the agriculture and manufacturing industries.
America’s third-biggest economy, New York, grew just 0.7% in 2023, falling far below the U.S. average. High interest rates took a toll on key sectors, with notable slowdowns in the construction and manufacturing sectors. In addition, falling home prices and a weaker job market contributed to slower economic growth.
Meanwhile, Georgia experienced the fifth-lowest real GDP growth rate. In March 2024, Rivian paused plans to build a $5 billion EV factory in Georgia, which was set to be one of the biggest economic development initiatives in the state in history.
These delays are likely to exacerbate setbacks for the state, however, both Kia and Hyundai have made significant investments in the EV industry, which could help boost Georgia’s manufacturing sector looking ahead.

-

 Personal Finance1 week ago
Visualizing the Tax Burden of Every U.S. State
-

 Misc6 days ago
Visualized: Aircraft Carriers by Country
-

 Culture7 days ago
How Popular Snack Brand Logos Have Changed
-

 Mining1 week ago
Visualizing Copper Production by Country in 2023
-

 Misc1 week ago
Charted: How Americans Feel About Federal Government Agencies
-

 Healthcare1 week ago
Which Countries Have the Highest Infant Mortality Rates?
-

 Demographics1 week ago
Mapped: U.S. Immigrants by Region
-

 Maps1 week ago
Mapped: Southeast Asia’s GDP Per Capita, by Country