Money
How Debt-to-GDP Ratios Have Changed Since 2000
![]() See this visualization first on the Voronoi app.
See this visualization first on the Voronoi app.

How Debt-to-GDP Ratios Have Changed Since 2000
This was originally posted on our Voronoi app. Download the app for free on Apple or Android and discover incredible data-driven charts from a variety of trusted sources.
Government debt levels have grown in most parts of the world since the 2008 financial crisis, and even more so after the COVID-19 pandemic.
To gain perspective on this long-term trend, we’ve visualized the debt-to-GDP ratios of advanced economies, as of 2000 and 2024 (estimated). All figures were sourced from the IMF’s World Economic Outlook.
Data and Highlights
The data we used to create this graphic is listed in the table below. “Government gross debt” consists of all liabilities that require payment(s) of interest and/or principal in the future.
| Country | 2000 (%) | 2024 (%) | Change (pp) |
|---|---|---|---|
| 🇯🇵 Japan | 135.6 | 251.9 | +116.3 |
| 🇸🇬 Singapore | 82.3 | 168.3 | +86.0 |
| 🇺🇸 United States | 55.6 | 126.9 | +71.3 |
| 🇬🇧 United Kingdom | 36.6 | 105.9 | +69.3 |
| 🇬🇷 Greece | 104.9 | 160.2 | +55.3 |
| 🇫🇷 France | 58.9 | 110.5 | +51.6 |
| 🇵🇹 Portugal | 54.2 | 104.0 | +49.8 |
| 🇪🇸 Spain | 57.8 | 104.7 | +46.9 |
| 🇸🇮 Slovenia | 25.9 | 66.5 | +40.6 |
| 🇫🇮 Finland | 42.4 | 76.5 | +34.1 |
| 🇭🇷 Croatia | 35.4 | 61.8 | +26.4 |
| 🇨🇦 Canada | 80.4 | 103.3 | +22.9 |
| 🇨🇾 Cyprus | 56.0 | 70.9 | +14.9 |
| 🇦🇹 Austria | 65.7 | 74.0 | +8.3 |
| 🇸🇰 Slovak Republic | 50.5 | 56.5 | +6.0 |
| 🇩🇪 Germany | 59.3 | 64.0 | +4.7 |
| 🇧🇪 Belgium | 109.6 | 106.8 | -2.8 |
| 🇮🇱 Israel | 77.4 | 56.8 | -20.6 |
| 🇮🇸 Iceland | 75.8 | 54.6 | -21.2 |
The debt-to-GDP ratio indicates how much a country owes compared to the size of its economy, reflecting its ability to manage and repay debts. Percentage point (pp) changes shown above indicate the increase or decrease of these ratios.
Countries with the Biggest Increases
Japan (+116 pp), Singapore (+86 pp), and the U.S. (+71 pp) have grown their debt as a percentage of GDP the most since the year 2000.
All three of these countries have stable, well-developed economies, so it’s unlikely that any of them will default on their growing debts. With that said, higher government debt leads to increased interest payments, which in turn can diminish available funds for future government budgets.
This is a rising issue in the U.S., where annual interest payments on the national debt have surpassed $1 trillion for the first time ever.
Only 3 Countries Saw Declines
Among this list of advanced economies, Belgium (-2.8 pp), Iceland (-21.2 pp), and Israel (-20.6 pp) were the only countries that decreased their debt-to-GDP ratio since the year 2000.
According to Fitch Ratings, Iceland’s debt ratio has decreased due to strong GDP growth and the use of its cash deposits to pay down upcoming maturities.
See More Debt Graphics from Visual Capitalist
Curious to see which countries have the most government debt in dollars? Check out this graphic that breaks down $97 trillion in debt as of 2023.


Markets
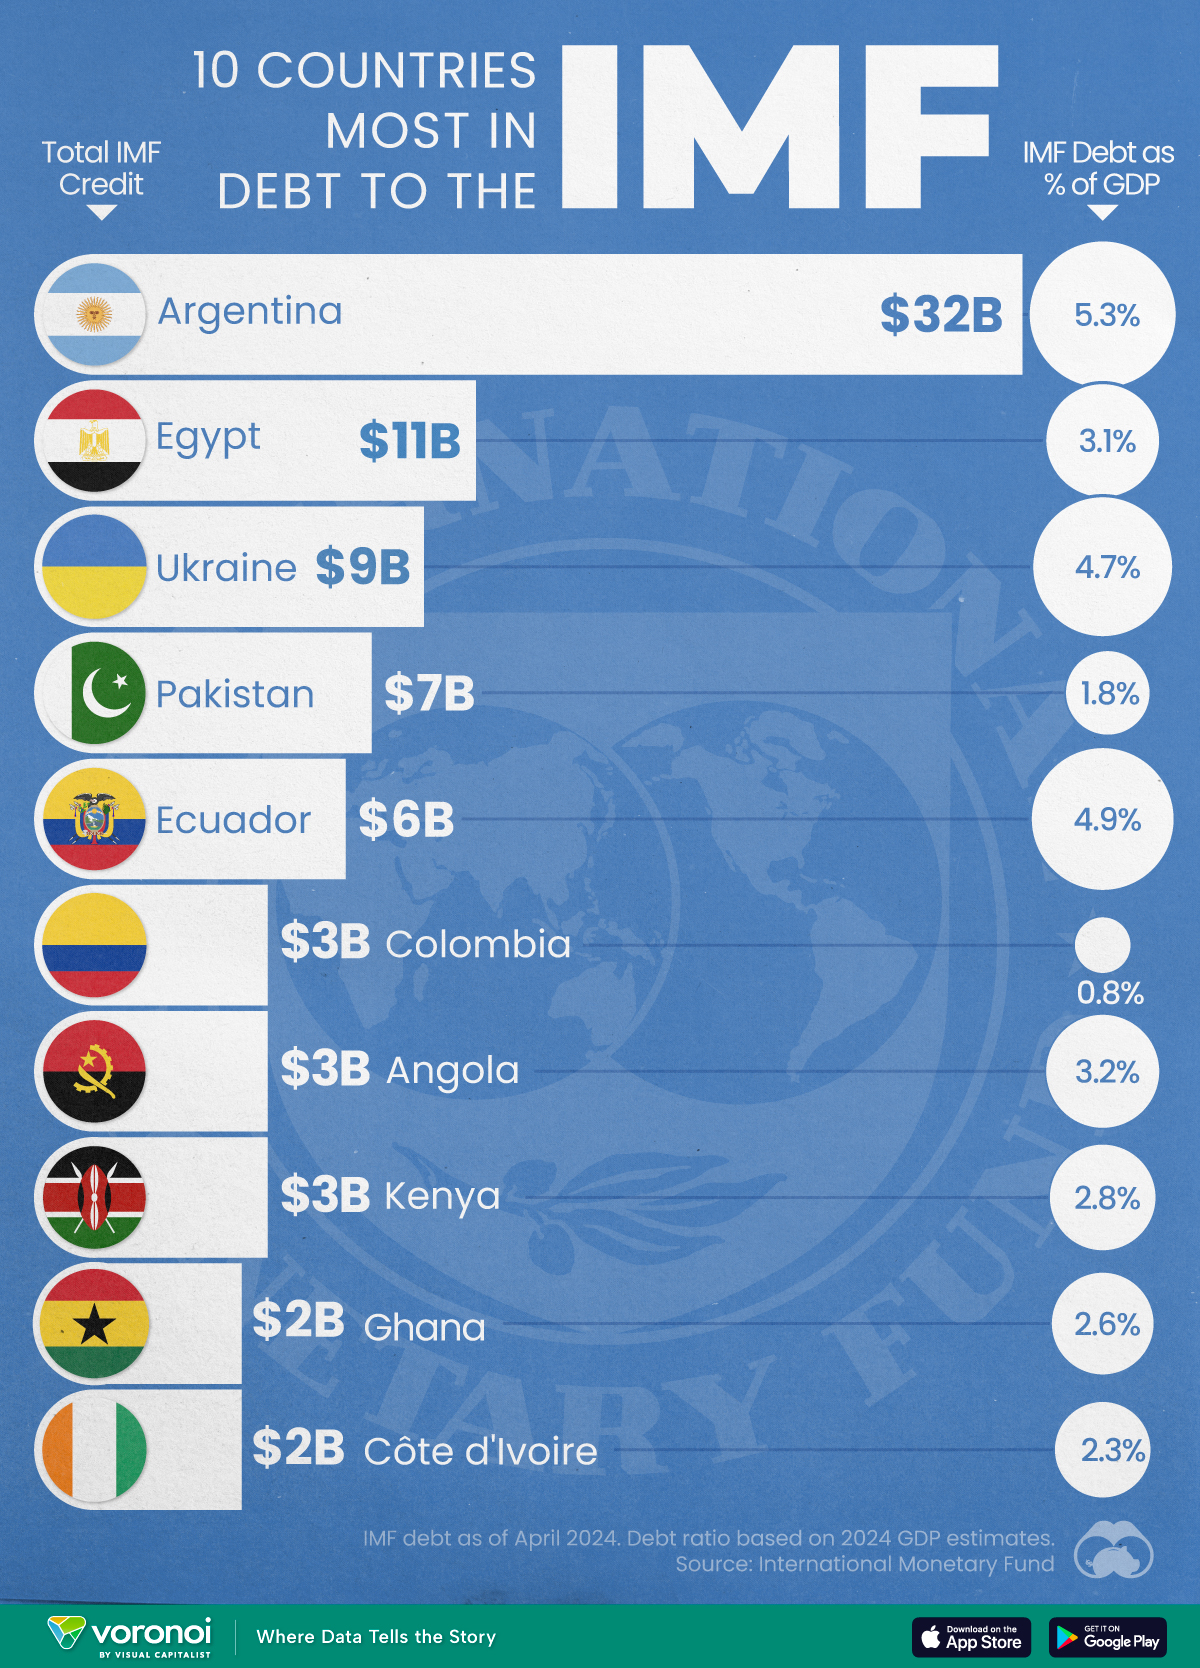
Top 10 Countries Most in Debt to the IMF
Argentina tops the ranking, with a debt equivalent to 5.3% of the country’s GDP.
Top 10 Countries Most in Debt to the IMF
This was originally posted on our Voronoi app. Download the app for free on iOS or Android and discover incredible data-driven charts from a variety of trusted sources.
Established in 1944, the International Monetary Fund (IMF) supports countries’ economic growth by providing financial aid and guidance on policies to enhance stability, productivity, and job opportunities.
Countries seek loans from the IMF to address economic crises, stabilize their currencies, implement structural reforms, and alleviate balance of payments difficulties.
In this graphic, we visualize the 10 countries most indebted to the fund.
Methodology
We compiled this ranking using the International Monetary Fund’s data on Total IMF Credit Outstanding. We selected the latest debt data for each country, accurate as of April 29, 2024.
Argentina Tops the Rank
Argentina’s debt to the IMF is equivalent to 5.3% of the country’s GDP. In total, the country owns more than $32 billion.
| Country | IMF Credit Outstanding ($B) | GDP ($B, 2024) | IMF Debt as % of GDP |
|---|---|---|---|
| 🇦🇷 Argentina | 32 | 604.3 | 5.3 |
| 🇪🇬 Egypt | 11 | 347.6 | 3.1 |
| 🇺🇦 Ukraine | 9 | 188.9 | 4.7 |
| 🇵🇰 Pakistan | 7 | 374.7 | 1.8 |
| 🇪🇨 Ecuador | 6 | 121.6 | 4.9 |
| 🇨🇴 Colombia | 3 | 386.1 | 0.8 |
| 🇦🇴 Angola | 3 | 92.1 | 3.2 |
| 🇰🇪 Kenya | 3 | 104.0 | 2.8 |
| 🇬🇭 Ghana | 2 | 75.2 | 2.6 |
| 🇨🇮 Ivory Coast | 2 | 86.9 | 2.3 |
A G20 member and major grain exporter, the country’s history of debt trouble dates back to the late 1890s when it defaulted after contracting debts to modernize the capital, Buenos Aires. It has already been bailed out over 20 times in the last six decades by the IMF.
Five of the 10 most indebted countries are in Africa, while three are in South America.
The only European country on our list, Ukraine has relied on international support amidst the conflict with Russia. It is estimated that Russia’s full-scale invasion of the country caused the loss of a third of the country’s economy. The country owes $9 billion to the IMF.
In total, almost 100 countries owe money to the IMF, and the grand total of all of these debts is $111 billion. The above countries (top 10) account for about 69% of these debts.

-

 United States6 days ago
Mapped: Countries Where Recreational Cannabis is Legal
-

 Healthcare2 weeks ago
Life Expectancy by Region (1950-2050F)
-

 Markets2 weeks ago
The Growth of a $1,000 Equity Investment, by Stock Market
-

 Markets2 weeks ago
Mapped: Europe’s GDP Per Capita, by Country
-

 Money2 weeks ago
Charted: What Frustrates Americans About the Tax System
-

 Technology1 week ago
Countries With the Highest Rates of Crypto Ownership
-

 Mining1 week ago
Where the World’s Aluminum is Smelted, by Country
-

 Personal Finance1 week ago
Visualizing the Tax Burden of Every U.S. State