Mining
Gold vs. S&P 500: Which Has Grown More Over Five Years?
![]() See this visualization first on the Voronoi app.
See this visualization first on the Voronoi app.

Gold vs. S&P 500: Which Has Grown More Over Five Years?
This was originally posted on our Voronoi app. Download the app for free on Apple or Android and discover incredible data-driven charts from a variety of trusted sources.
Gold is considered a unique asset due to its enduring value, historical significance, and application in various technologies like computers, spacecraft, and communications equipment.
Commonly regarded as a “safe haven asset”, gold is something investors typically buy to protect themselves during periods of global uncertainty and economic decline.
It is for this reason that gold has performed rather strongly in recent years, and especially in 2024. Persistent inflation combined with multiple wars has driven up demand for gold, helping it set a new all-time high of over $2,400 per ounce.
To put this into perspective, we visualized the performance of gold alongside the S&P 500. See the table below for performance figures as of April 12, 2024.
| Asset/Index | 1 Yr (%) | 5 Yr (%) |
|---|---|---|
| 🏆 Gold | +16.35 | +81.65 |
| 💼 S&P 500 | +25.21 | +76.22 |
Over the five-year period, gold has climbed an impressive 81.65%, outpacing even the S&P 500.
Get Your Gold at Costco
Perhaps a sign of how high the demand for gold is becoming, wholesale giant Costco is reportedly selling up to $200 million worth of gold bars every month in the United States. The year prior, sales only amounted to $100 million per quarter.
Consumers aren’t the only ones buying gold, either. Central banks around the world have been accumulating gold in very large quantities, likely as a hedge against inflation.
According to the World Gold Council, these institutions bought 1,136 metric tons in 2022, marking the highest level since 1950. Figures for 2023 came in at 1,037 metric tons.
See More Graphics on Gold
If you’re fascinated by gold, be sure to check out more Visual Capitalist content including 200 Years of Global Gold Production, by Country or Ranked: The Largest Gold Reserves by Country.


Mining
The Biggest Salt Producing Countries in 2023
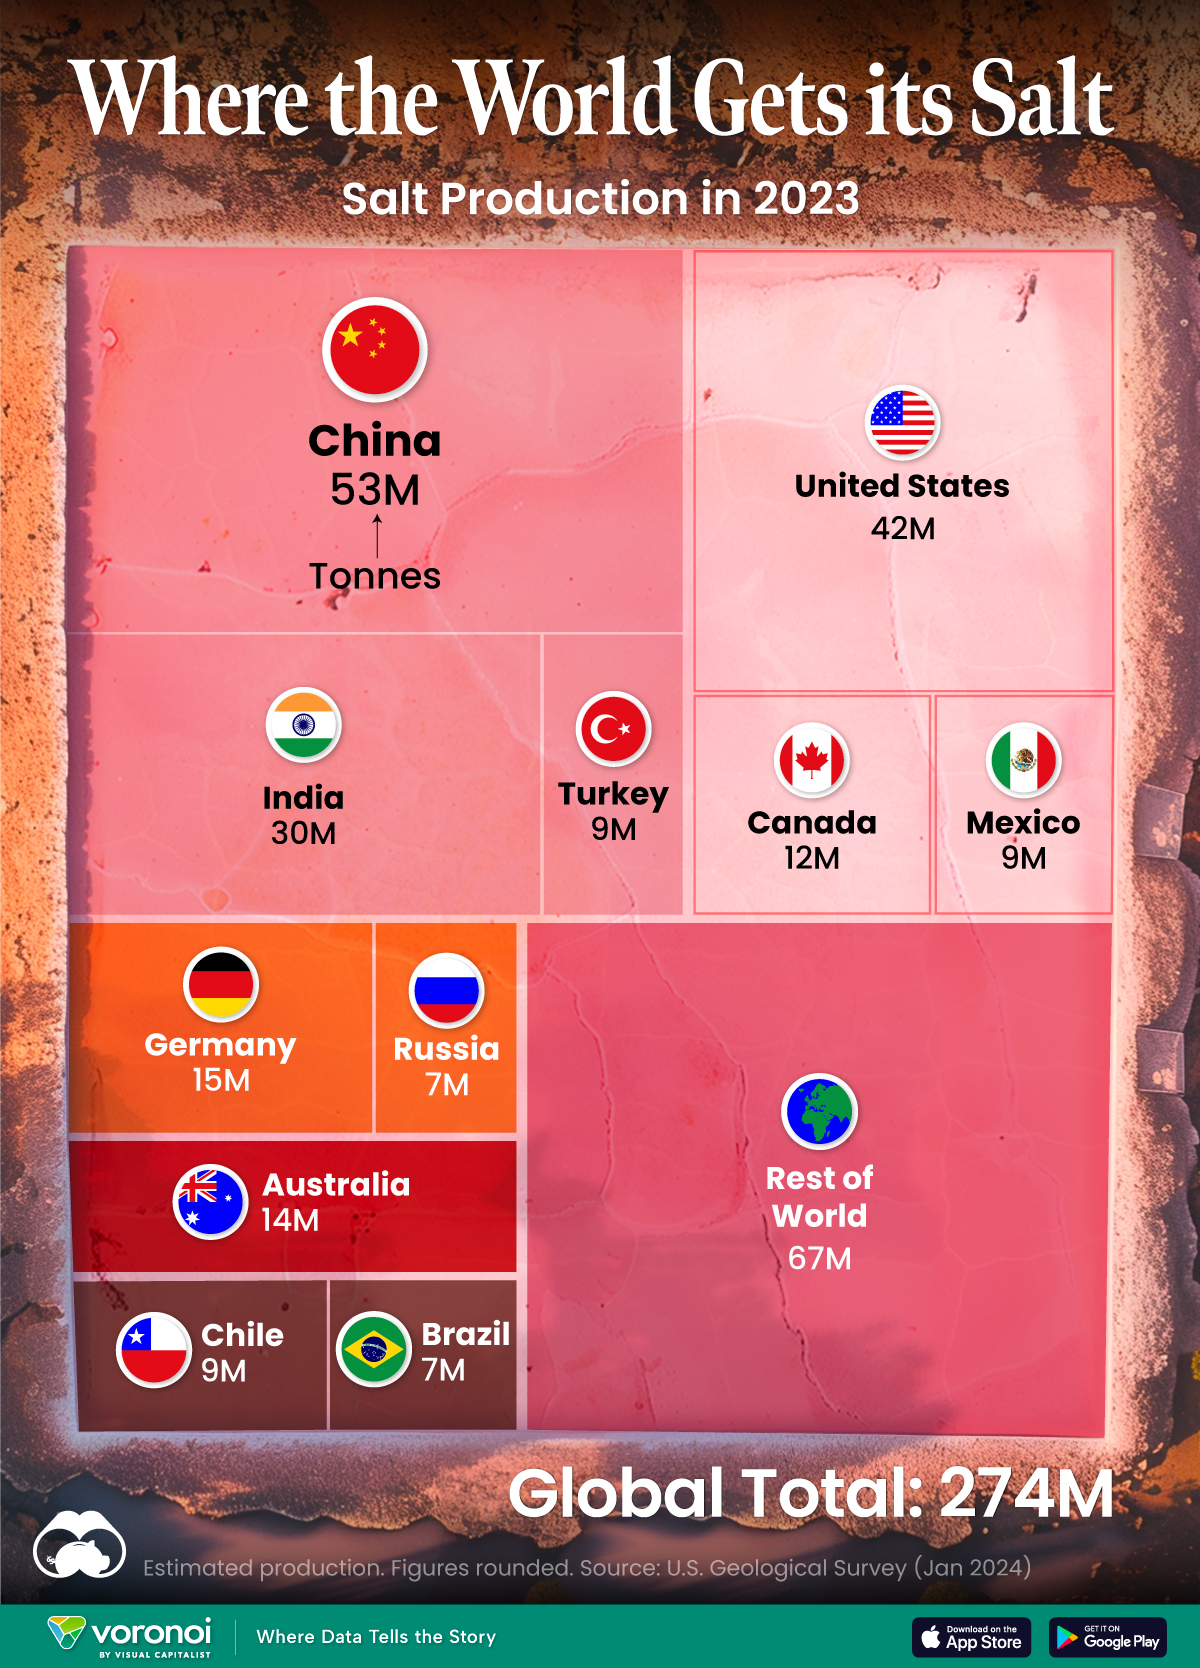
In this graphic, we break down global salt production in 2023. China is currently the top producer, accounting for almost 20% of output.
The Biggest Salt Producing Countries in 2023
This was originally posted on our Voronoi app. Download the app for free on iOS or Android and discover incredible data-driven charts from a variety of trusted sources.
Humanity has utilized salt for thousands of years, dating back to ancient civilizations. The U.S. alone consumes more than 48 million tonnes of salt per year.
In this graphic, we break down global salt production in 2023, measured in tonnes. These estimates come from the U.S. Geological Survey’s latest commodity report on salt.
Ample Supply
Salt is essential for human life, serving various purposes including food preservation, flavor enhancement, industrial processes, and health maintenance. The good news is that the world’s continental resources of salt are vast, and the salt content in the oceans is nearly unlimited.
China is currently the top producer of salt, with almost 20% of the output, followed by the U.S. (15%) and India (11%).
| Country | Production (tonnes) |
|---|---|
| 🇨🇳 China | 53,000,000 |
| 🇺🇸 United States | 42,000,000 |
| 🇮🇳 India | 30,000,000 |
| 🇩🇪 Germany | 15,000,000 |
| 🇦🇺 Australia | 14,000,000 |
| 🇨🇦 Canada | 12,000,000 |
| 🇨🇱 Chile | 9,200,000 |
| 🇲🇽 Mexico | 9,000,000 |
| 🇹🇷 Turkey | 9,000,000 |
| 🇷🇺 Russia | 7,000,000 |
| 🇧🇷 Brazil | 6,600,000 |
| Rest of world | 67,000,000 |
| Global total | 273,800,000 |
The global salt market was valued at $32.6 billion in 2022.
It’s projected to grow from $34.1 billion in 2023 to $48.6 billion by 2030, with a CAGR of 5.2% during the forecast period. This suggests a surprising amount of growth for what is one of the world’s oldest and most common commodities.
Facts About the U.S. Salt Industry
In the U.S., salt is produced by 25 companies, which operate 63 plants across 16 states.
The states that produce the most salt are Kansas, Louisiana, Michigan, New York, Ohio, Texas, and Utah. Altogether, these states account for 95% of domestic production.
The primary uses of salt in the U.S. are highway de-icing (41%), chemical production (38%), and food processing (10%).

-

 Healthcare2 weeks ago
Which Countries Have the Highest Infant Mortality Rates?
-

 Misc1 week ago
Visualizing Global Losses from Financial Scams
-

 population1 week ago
Mapped: U.S. States By Number of Cities Over 250,000 Residents
-

 Culture1 week ago
Charted: How the Logos of Select Fashion Brands Have Evolved
-

 United States1 week ago
Mapped: Countries Where Recreational Cannabis is Legal
-

 Misc1 week ago
Visualized: Aircraft Carriers by Country
-

 Culture1 week ago
How Popular Snack Brand Logos Have Changed
-

 Mining2 weeks ago
Visualizing Copper Production by Country in 2023