Economy
G20 Inflation Rates: Feb 2024 vs COVID Peak
![]() See this visualization first on the Voronoi app.
See this visualization first on the Voronoi app.
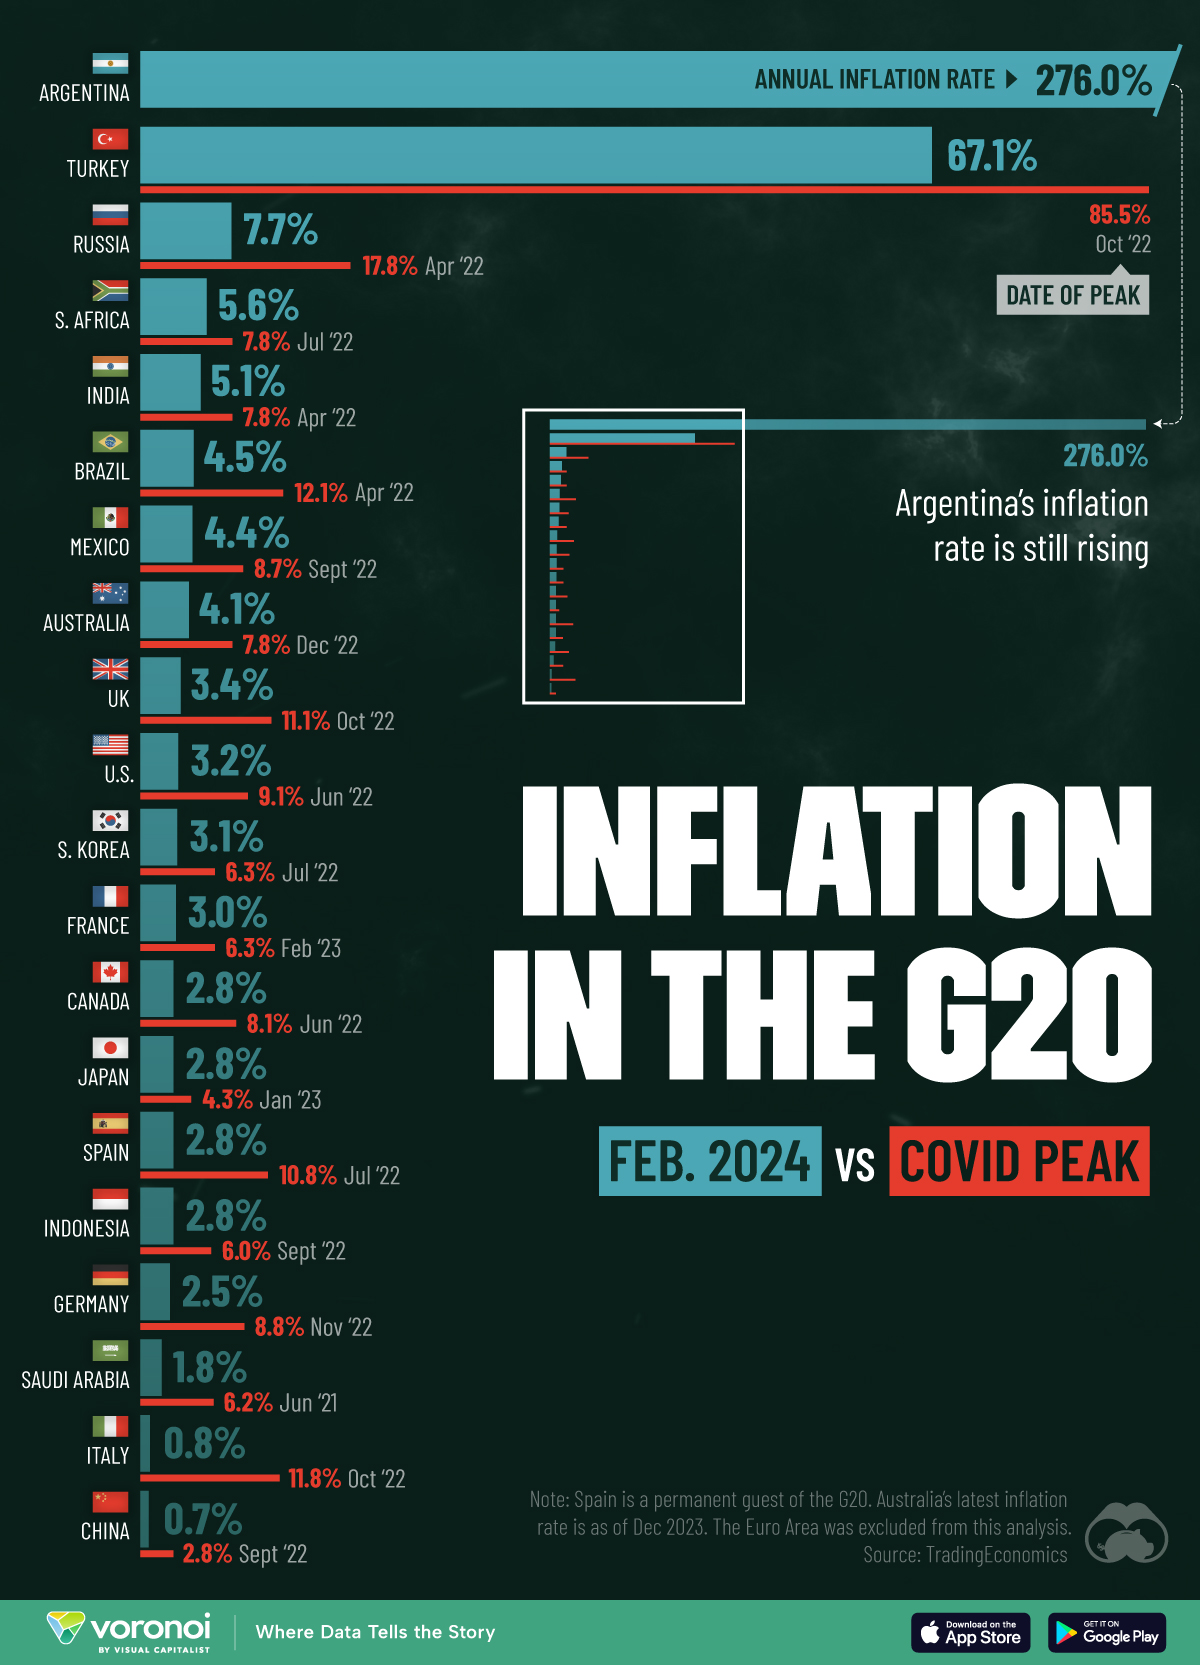
How Far Have Inflation Rates Fallen Across the G20?
This was originally posted on our Voronoi app. Download the app for free on iOS or Android and discover incredible data-driven charts from a variety of trusted sources.
A major economic consequence that arose in the aftermath of the COVID-19 pandemic was high inflation. In many countries, inflation rates reached double-digits, which is significantly higher than the 2-3% typically targeted by central banks.
Generally speaking, an extended period of fast rising prices is not optimal because it erodes the purchasing power of money. This makes everyday essentials like groceries, rent, and gas more expensive.
To see how inflation is currently faring, we’ve visualized annual inflation rates across G20 countries as of February 2024, in the context of their pandemic peak. This data was sourced from Trading Economics and can also be found in the table below.
| Country | Inflation (%, Feb 2024) | Inflation (%, COVID peak) | Date of Peak |
|---|---|---|---|
| 🇦🇷 Argentina | 276.0 | -- | -- |
| 🇹🇷 Turkey | 67.1 | 85.5 | Oct 2022 |
| 🇷🇺 Russia | 7.7 | 17.8 | Apr 2022 |
| 🇿🇦 South Africa | 5.6 | 7.8 | Jul 2022 |
| 🇮🇳 India | 5.1 | 7.8 | Apr 2022 |
| 🇧🇷 Brazil | 4.5 | 12.1 | Apr 2022 |
| 🇲🇽 Mexico | 4.4 | 8.7 | Sept 2022 |
| 🇦🇺 Australia | 4.1 | 7.8 | Dec 2022 |
| 🇬🇧 United Kingdom | 3.4 | 11.1 | Oct 2022 |
| 🇺🇸 United States | 3.2 | 9.1 | Jun 2022 |
| 🇰🇷 South Korea | 3.1 | 6.3 | Jul 2022 |
| 🇫🇷 France | 3.0 | 6.3 | Feb 2023 |
| 🇨🇦 Canada | 2.8 | 8.1 | Jun 2022 |
| 🇯🇵 Japan | 2.8 | 4.3 | Jan 2023 |
| 🇪🇸 Spain | 2.8 | 10.8 | Jul 2022 |
| 🇮🇩 Indonesia | 2.8 | 6 | Sept 2022 |
| 🇩🇪 Germany | 2.5 | 8.8 | Nov 2022 |
| 🇸🇦 Saudi Arabia | 1.8 | 6.2 | Jun 2021 |
| 🇮🇹 Italy | 0.8 | 11.8 | Oct 2022 |
| 🇨🇳 China | 0.7 | 2.8 | Sept 2022 |
Notes: Spain is a permanent guest of the G20. Australia’s latest inflation rate is as of Dec 2023.
Unlike other G20 nations, Argentina’s inflation rate has only gone up since the pandemic ended. This is largely due to the country’s history of printing money to compensate for government overspending.
One area hit particularly hard is food prices. According to a local consultancy, the price of beef to consumers rose by 40% to 70% between July to August 2023.
Learn More About Inflation in 2024
If you want to see more graphics on inflation, check out this global map that visualizes inflation forecasts for every country in 2024.


Maps
Mapped: The Top Exports in Asian Countries
Asia’s exports span a wide range, from petroleum to technology components and textile products.
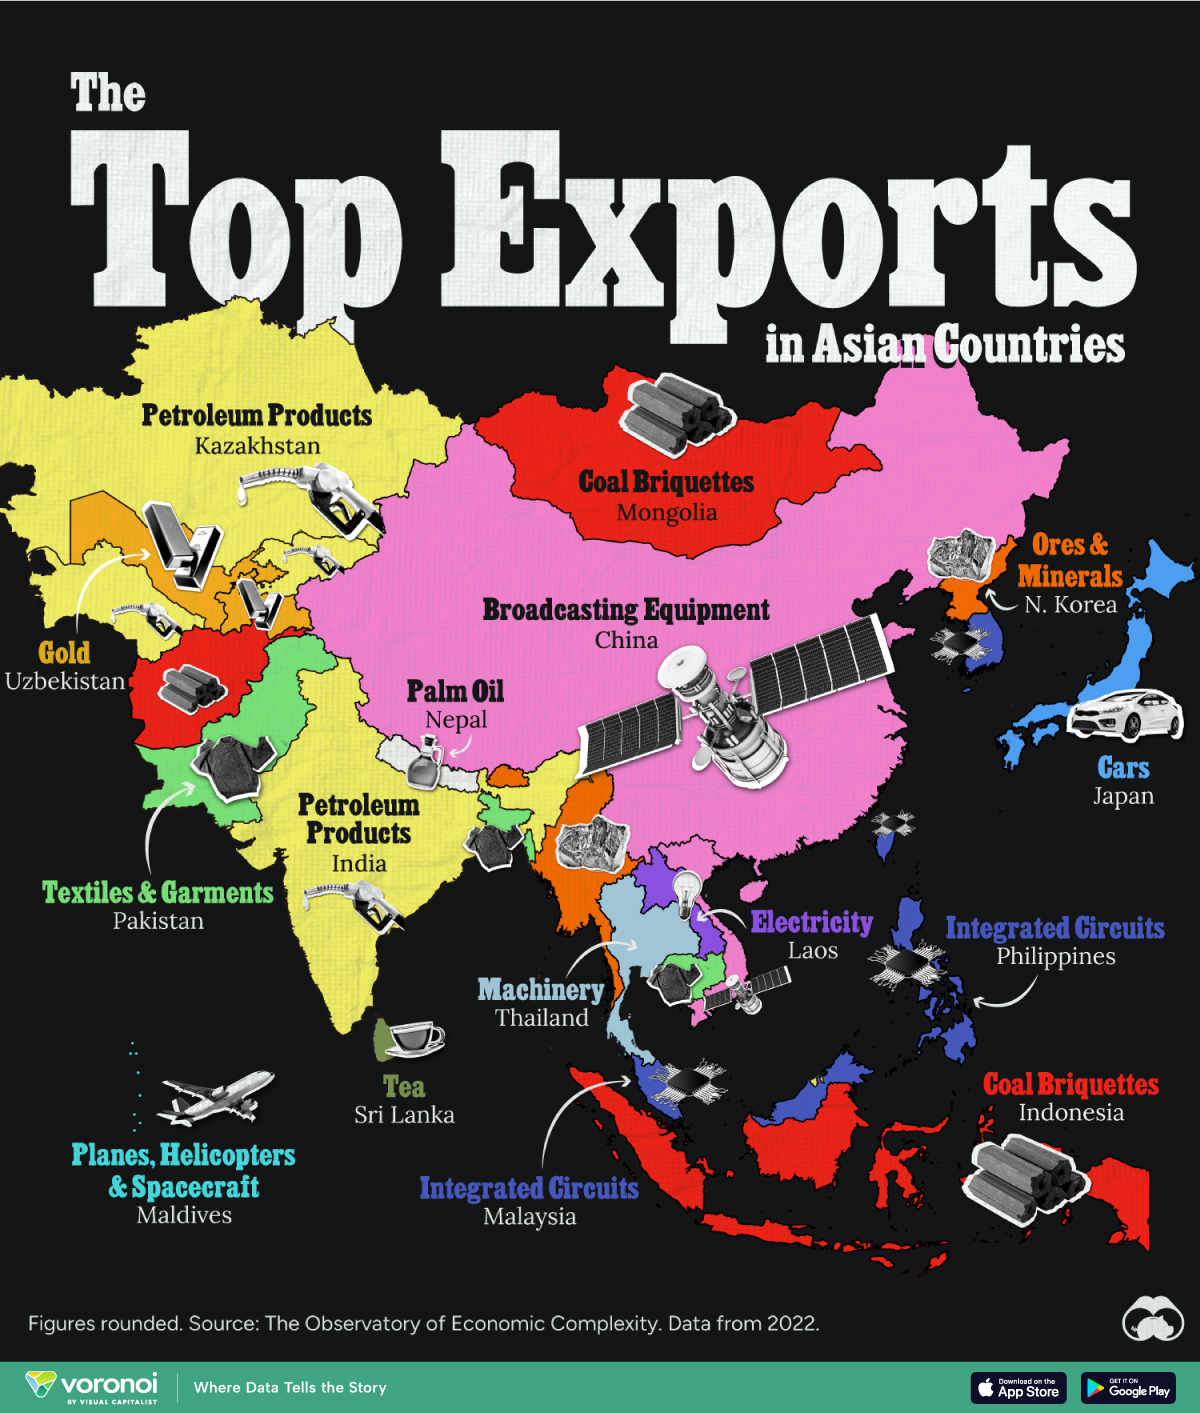
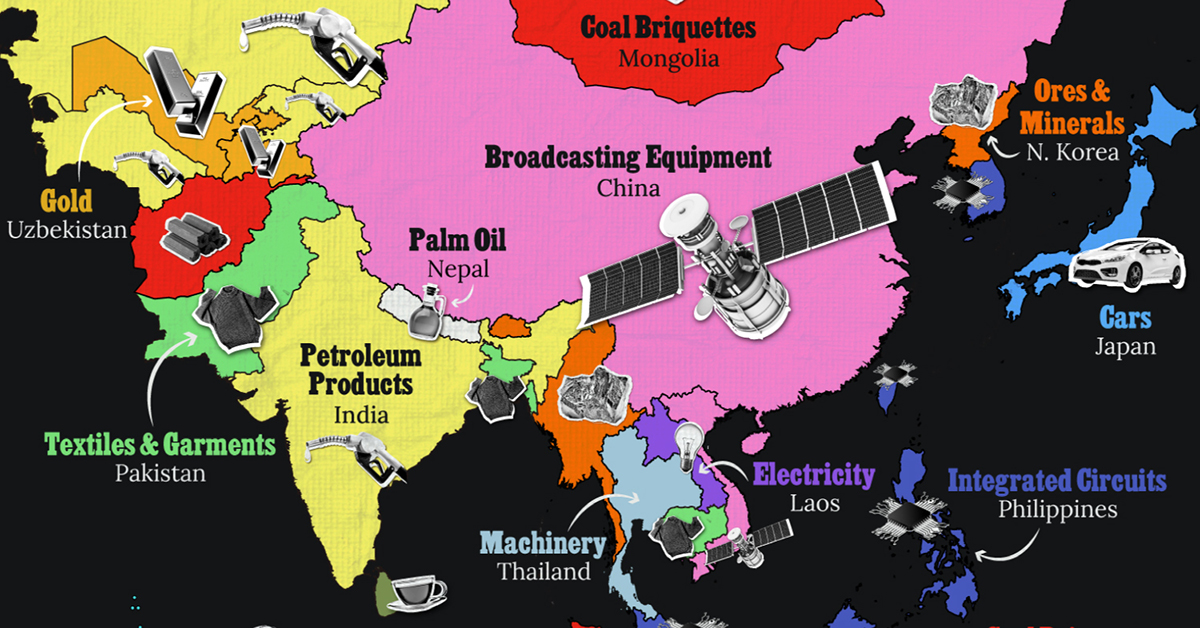
The Top Exports in Asian Countries
This was originally posted on our Voronoi app. Download the app for free on iOS or Android and discover incredible data-driven charts from a variety of trusted sources.
Asia’s exports span a wide range, from petroleum and minerals to technology components and textile products.
In this map, we display the top exports (as of 2022) of Asian countries, excluding Middle Eastern nations. Data was sourced from The Observatory of Economic Complexity.
Editor’s Note: For our most recent Middle East themed version of this map, go here.
Diverse Economies Across the Continent
Like in many other countries around the world, petroleum is a significant component of the Asian continental economy, with petroleum products as India’s top exporting category, amounting to approximately $86 billion per year in trade.
Another top product coming from Asia is integrated circuits. These are used in a multitude of applications spanning computing, communications, consumer electronics, automotive, industrial automation, medical devices, aerospace and defense.
| Country | Top Export (2022) | Top Export Value (USD Billions) |
|---|---|---|
| 🇨🇳 China | Broadcasting Equipment | $272.0 |
| 🇹🇼 Taiwan | Integrated Circuits | $223.0 |
| 🇰🇷 South Korea | Integrated Circuits | $121.0 |
| 🇯🇵 Japan | Cars | $89.0 |
| 🇮🇳 India | Petroleum Products | $86.2 |
| 🇸🇬 Singapore | Integrated Circuits | $81.9 |
| 🇲🇾 Malaysia | Integrated Circuits | $78.9 |
| 🇻🇳 Vietnam | Broadcasting Equipment | $58.5 |
| 🇮🇩 Indonesia | Coal Briquettes | $50.8 |
| 🇰🇿 Kazakhstan | Petroleum Products | $47.6 |
| 🇵🇭 Philippines | Integrated Circuits | $32.4 |
| 🇦🇿 Azerbaijan | Petroleum Products | $19.4 |
| 🇹🇭 Thailand | Machinery | $19.3 |
| 🇹🇲 Turkmenistan | Petroleum Products | $9.2 |
| 🇧🇩 Bangladesh | Textiles and Garments | $9.1 |
| 🇲🇳 Mongolia | Coal Briquettes | $6.5 |
| 🇺🇿 Uzbekistan | Gold | $5.2 |
| 🇧🇳 Brunei | Petroleum Products | $4.9 |
| 🇵🇰 Pakistan | Textiles and Garments | $4.9 |
| 🇲🇲 Myanmar (Burma) | Ore & Minerals | $4.1 |
| 🇰🇭 Cambodia | Textiles and Garments | $3.1 |
| 🇱🇦 Laos | Electricity | $2.4 |
| 🇱🇰 Sri Lanka | Tea | $1.3 |
| 🇬🇪 Georgia | Ore & Minerals | $1.0 |
| 🇦🇲 Armenia | Ore & Minerals | $0.7 |
| 🇹🇯 Tajikistan | Gold | $0.6 |
| 🇦🇫 Afghanistan | Coal Briquettes | $0.4 |
| 🇲🇻 Maldives | Planes, Helicopters, Spacecraft | $0.4 |
| 🇧🇹 Bhutan | Ore & Minerals | $0.3 |
| 🇹🇱 Timor-Leste (East Timor) | Petroleum Products | $0.3 |
| 🇳🇵 Nepal | Palm Oil | $0.2 |
| 🇰🇬 Kyrgyzstan | Petroleum Products | $0.1 |
| 🇰🇵 North Korea | Ore & Minerals | $0.03 |
In addition, the region is also a big manufacturer of semiconductors, crucial for applications ranging from telecommunications and artificial intelligence to renewable energy and healthcare. Taiwan holds a 68% share of the advanced semiconductor market.
Pakistan, Bangladesh, and Cambodia are major producers of textile products such as t-shirts, sweaters, and household linens. Most of their products go to the United States and Europe, feeding popular outfit brands.
Asia stands out as a top producer of minerals and fuel, with Afghanistan, Indonesia, and Mongolia being top producers of coal briquettes used for heating, cooking, and industrial processes, while Armenia, Georgia, Bhutan, Myanmar (Burma), and North Korea rely on ore and mineral extraction as their top exporting sector.
The largest Asian economy, China, is known for the production of a variety of products, but its top exports come from broadcasting equipment, including TVs, cameras, and radios.

-

 Demographics6 days ago
Mapped: U.S. Immigrants by Region
-

 United States2 weeks ago
Charted: What Southeast Asia Thinks About China & the U.S.
-

 United States2 weeks ago
The Evolution of U.S. Beer Logos
-

 Healthcare2 weeks ago
What Causes Preventable Child Deaths?
-

 Energy1 week ago
Who’s Building the Most Solar Energy?
-

 Markets1 week ago
Mapped: The Most Valuable Company in Each Southeast Asian Country
-

 Technology1 week ago
Mapped: The Number of AI Startups By Country
-

 Healthcare1 week ago
Life Expectancy by Region (1950-2050F)