Economy
Where U.S. Inflation Hit the Hardest in March 2024
![]() See this visualization first on the Voronoi app.
See this visualization first on the Voronoi app.
Where U.S. Inflation Hit the Hardest (March 2024)
This was originally posted on our Voronoi app. Download the app for free on iOS or Android and discover incredible data-driven charts from a variety of trusted sources.
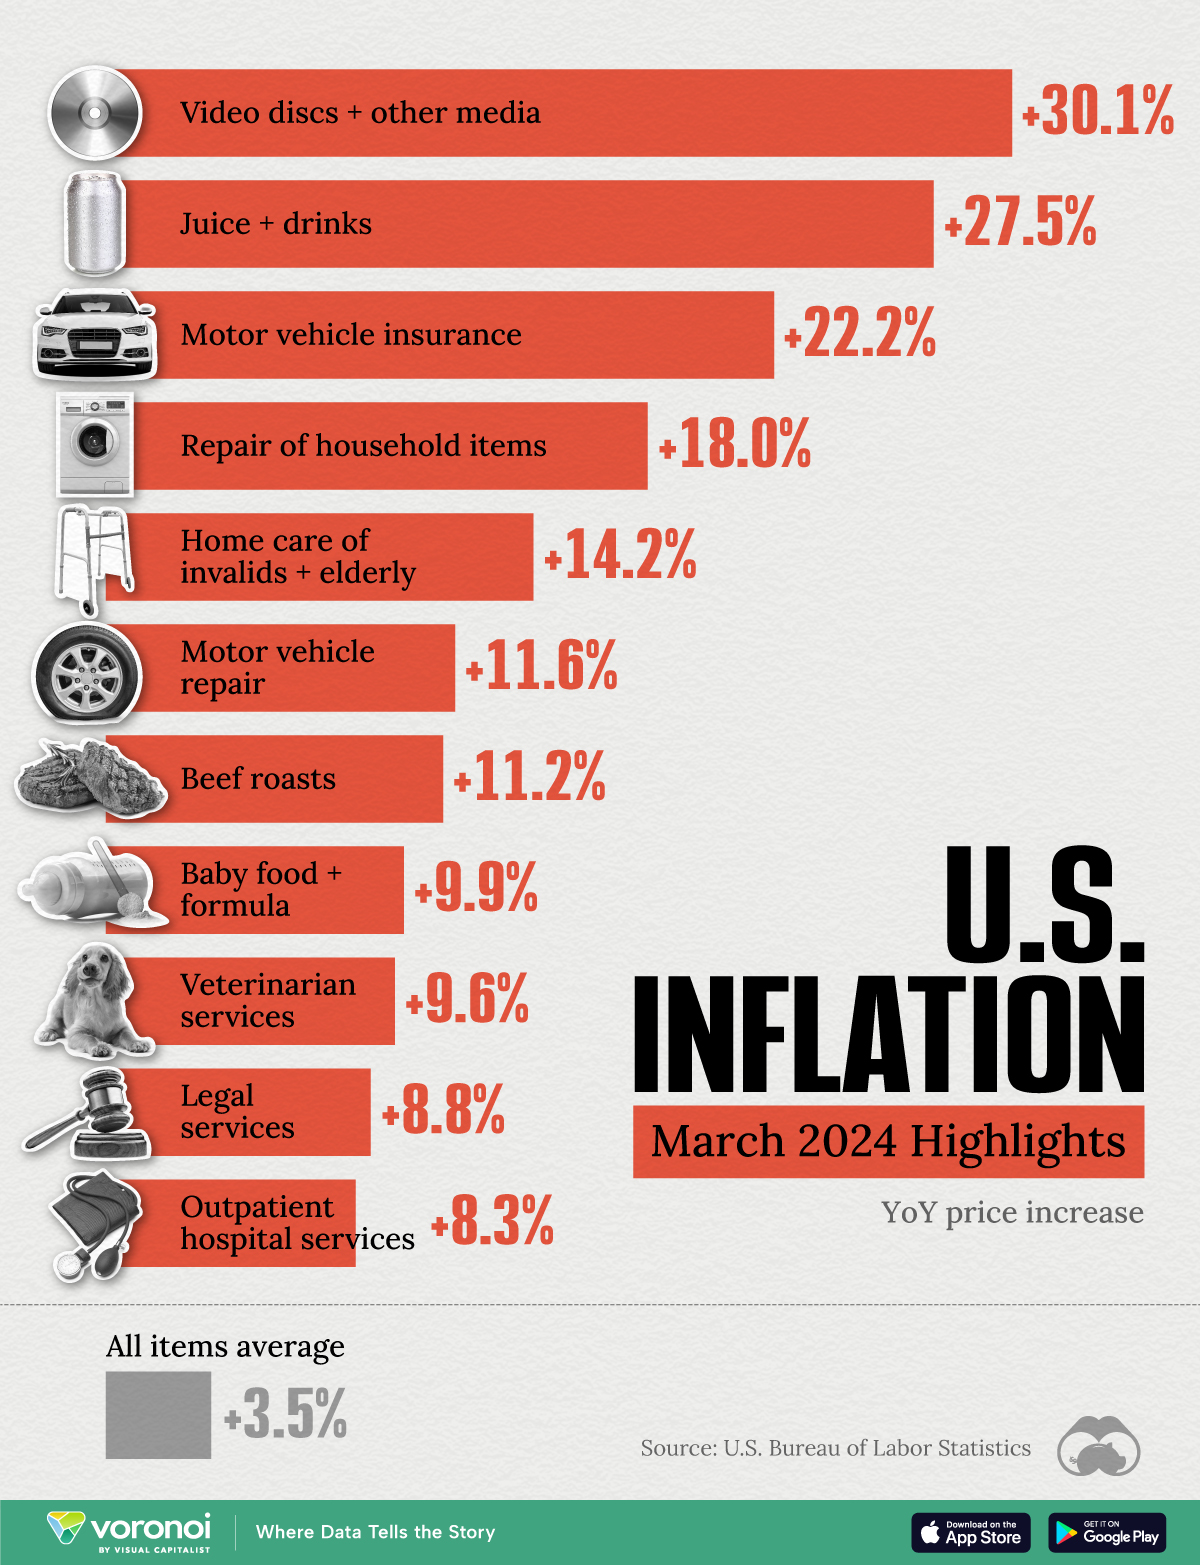
The latest U.S. inflation figures were released in early April, revealing that the consumer price index (CPI) had risen by 3.5% in March 2024, on an annual basis. This is unfortunately higher than the 3.2% logged in February, showing once again how stubborn inflation has been post-pandemic.
To add context to these figures, we’ve visualized CPI categories that became significantly more expensive from March 2023 to March 2024. All figures come from the U.S. Bureau of Labor Statistics, which regularly posts CPI figures.
Data and Highlights
The data we used to create this graphic is listed in the table below.
| Item | YoY Change (%) |
|---|---|
| 📀 Video discs + other media | 30.1 |
| 🥤 Juice + drinks | 27.5 |
| 🚗 Motor vehicle insurance | 22.2 |
| 🔧 Repair of household items | 18 |
| 🏠 Home care of invalids + elderly | 14.2 |
| 🚗 Motor vehicle repair | 11.6 |
| 🥩 Beef roasts | 11.2 |
| 👶 Baby food + formula | 9.9 |
| 🐾 Veterinarian services | 9.6 |
| ⚖️ Legal services | 8.8 |
| 🏥 Outpatient hospital services | 8.3 |
| 📊 All items average | 3.5 |
Prices of “video discs and other media” rose by a substantial 30.1% year-over-year as of March 2024, highlighting rising demand for physical media such as vinyl records.
According to an article from The Guardian, U.S. vinyl sales rose 21.7% in the first half of 2023, driven by artists like Taylor Swift, Lana Del Rey, and Fleetwood Mac. Swift’s latest album, Midnights, sold nearly 500,000 vinyl copies throughout the entire year.
Another category that rose significantly was “juice and drinks”, at 27.5%. This rise in cost has been attributed to numerous factors including sugar shortages, increased transportation costs, and diseases affecting orange trees in Florida.
See more graphics on inflation
If you enjoyed this post, check out this graphic on inflation rates across the G20. For each country, we compared inflation rates in February 2024 to their COVID-19 peak.


Maps
Mapped: The Top Exports in Asian Countries
Asia’s exports span a wide range, from petroleum to technology components and textile products.
The Top Exports in Asian Countries
This was originally posted on our Voronoi app. Download the app for free on iOS or Android and discover incredible data-driven charts from a variety of trusted sources.
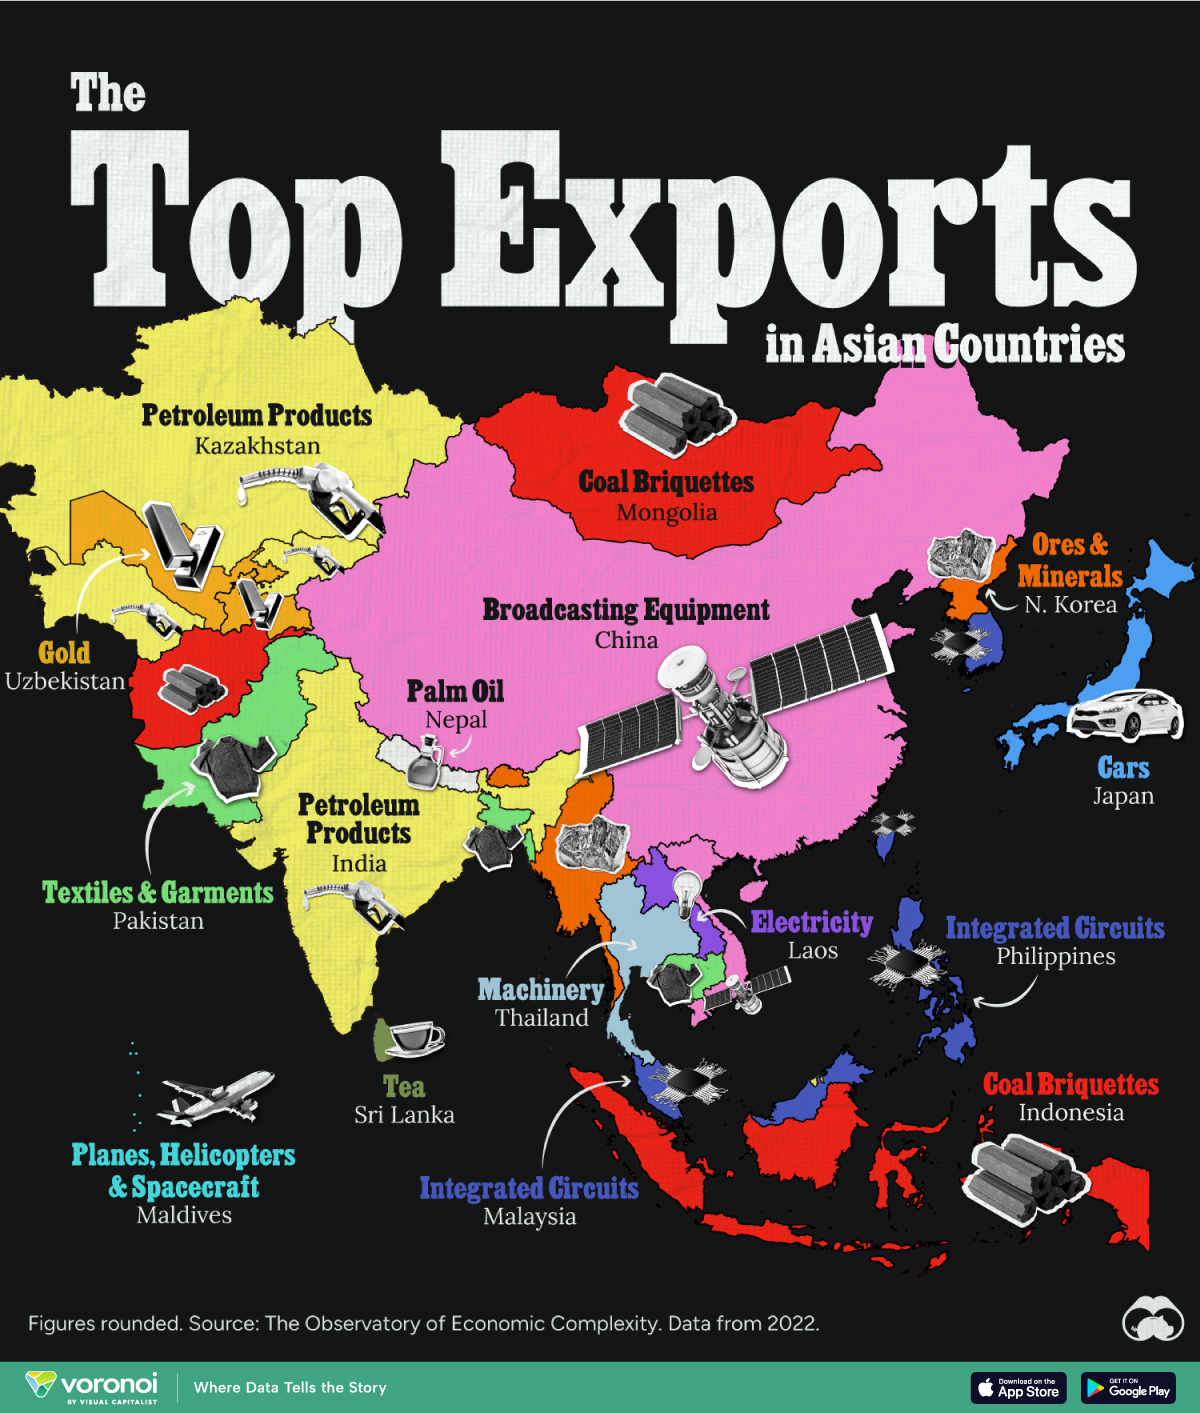
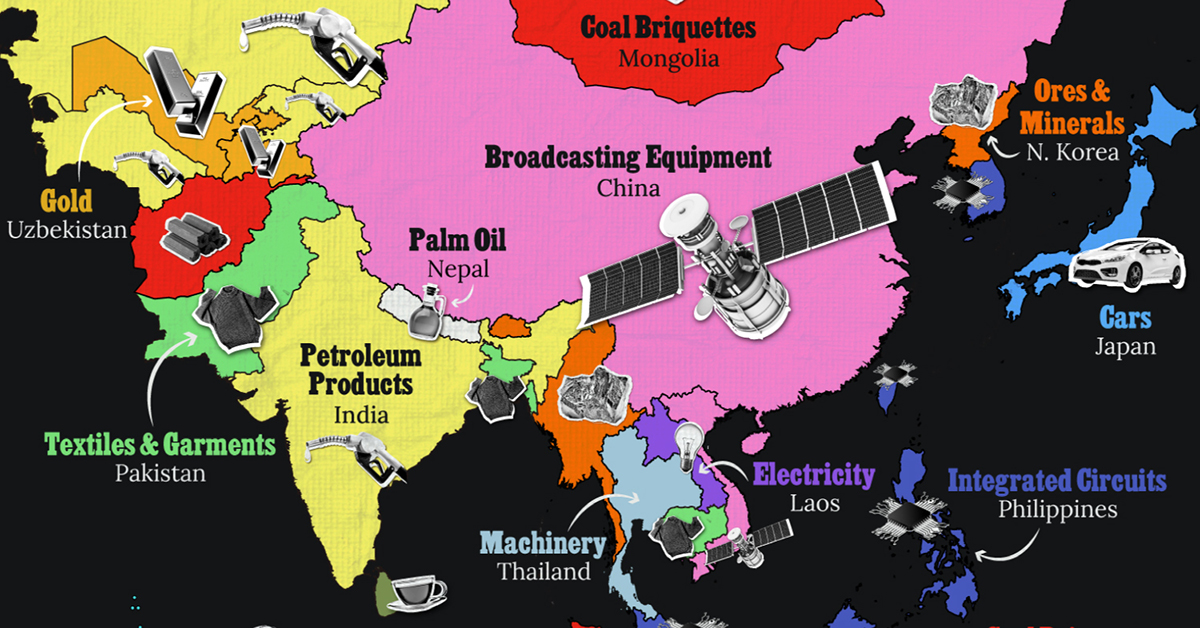
Asia’s exports span a wide range, from petroleum and minerals to technology components and textile products.
In this map, we display the top exports (as of 2022) of Asian countries, excluding Middle Eastern nations. Data was sourced from The Observatory of Economic Complexity.
Editor’s Note: For our most recent Middle East themed version of this map, go here.
Diverse Economies Across the Continent
Like in many other countries around the world, petroleum is a significant component of the Asian continental economy, with petroleum products as India’s top exporting category, amounting to approximately $86 billion per year in trade.
Another top product coming from Asia is integrated circuits. These are used in a multitude of applications spanning computing, communications, consumer electronics, automotive, industrial automation, medical devices, aerospace and defense.
| Country | Top Export (2022) | Top Export Value (USD Billions) |
|---|---|---|
| 🇨🇳 China | Broadcasting Equipment | $272.0 |
| 🇹🇼 Taiwan | Integrated Circuits | $223.0 |
| 🇰🇷 South Korea | Integrated Circuits | $121.0 |
| 🇯🇵 Japan | Cars | $89.0 |
| 🇮🇳 India | Petroleum Products | $86.2 |
| 🇸🇬 Singapore | Integrated Circuits | $81.9 |
| 🇲🇾 Malaysia | Integrated Circuits | $78.9 |
| 🇻🇳 Vietnam | Broadcasting Equipment | $58.5 |
| 🇮🇩 Indonesia | Coal Briquettes | $50.8 |
| 🇰🇿 Kazakhstan | Petroleum Products | $47.6 |
| 🇵🇭 Philippines | Integrated Circuits | $32.4 |
| 🇦🇿 Azerbaijan | Petroleum Products | $19.4 |
| 🇹🇭 Thailand | Machinery | $19.3 |
| 🇹🇲 Turkmenistan | Petroleum Products | $9.2 |
| 🇧🇩 Bangladesh | Textiles and Garments | $9.1 |
| 🇲🇳 Mongolia | Coal Briquettes | $6.5 |
| 🇺🇿 Uzbekistan | Gold | $5.2 |
| 🇧🇳 Brunei | Petroleum Products | $4.9 |
| 🇵🇰 Pakistan | Textiles and Garments | $4.9 |
| 🇲🇲 Myanmar (Burma) | Ore & Minerals | $4.1 |
| 🇰🇭 Cambodia | Textiles and Garments | $3.1 |
| 🇱🇦 Laos | Electricity | $2.4 |
| 🇱🇰 Sri Lanka | Tea | $1.3 |
| 🇬🇪 Georgia | Ore & Minerals | $1.0 |
| 🇦🇲 Armenia | Ore & Minerals | $0.7 |
| 🇹🇯 Tajikistan | Gold | $0.6 |
| 🇦🇫 Afghanistan | Coal Briquettes | $0.4 |
| 🇲🇻 Maldives | Planes, Helicopters, Spacecraft | $0.4 |
| 🇧🇹 Bhutan | Ore & Minerals | $0.3 |
| 🇹🇱 Timor-Leste (East Timor) | Petroleum Products | $0.3 |
| 🇳🇵 Nepal | Palm Oil | $0.2 |
| 🇰🇬 Kyrgyzstan | Petroleum Products | $0.1 |
| 🇰🇵 North Korea | Ore & Minerals | $0.03 |
In addition, the region is also a big manufacturer of semiconductors, crucial for applications ranging from telecommunications and artificial intelligence to renewable energy and healthcare. Taiwan holds a 68% share of the advanced semiconductor market.
Pakistan, Bangladesh, and Cambodia are major producers of textile products such as t-shirts, sweaters, and household linens. Most of their products go to the United States and Europe, feeding popular outfit brands.
Asia stands out as a top producer of minerals and fuel, with Afghanistan, Indonesia, and Mongolia being top producers of coal briquettes used for heating, cooking, and industrial processes, while Armenia, Georgia, Bhutan, Myanmar (Burma), and North Korea rely on ore and mineral extraction as their top exporting sector.
The largest Asian economy, China, is known for the production of a variety of products, but its top exports come from broadcasting equipment, including TVs, cameras, and radios.

-

 Demographics6 days ago
Mapped: U.S. Immigrants by Region
-

 United States2 weeks ago
Charted: What Southeast Asia Thinks About China & the U.S.
-

 United States2 weeks ago
The Evolution of U.S. Beer Logos
-

 Healthcare2 weeks ago
What Causes Preventable Child Deaths?
-

 Energy1 week ago
Who’s Building the Most Solar Energy?
-

 Markets1 week ago
Mapped: The Most Valuable Company in Each Southeast Asian Country
-

 Technology1 week ago
Mapped: The Number of AI Startups By Country
-

 Healthcare1 week ago
Life Expectancy by Region (1950-2050F)