Personal Finance
Mapped: Minimum Wage Around the World
Mapped: Minimum Wage Around the World
The purpose of a minimum wage is to establish a baseline income level for workers in a given jurisdiction. Ideally it’s enough to cover basic needs like food and housing, but this isn’t always a guarantee.
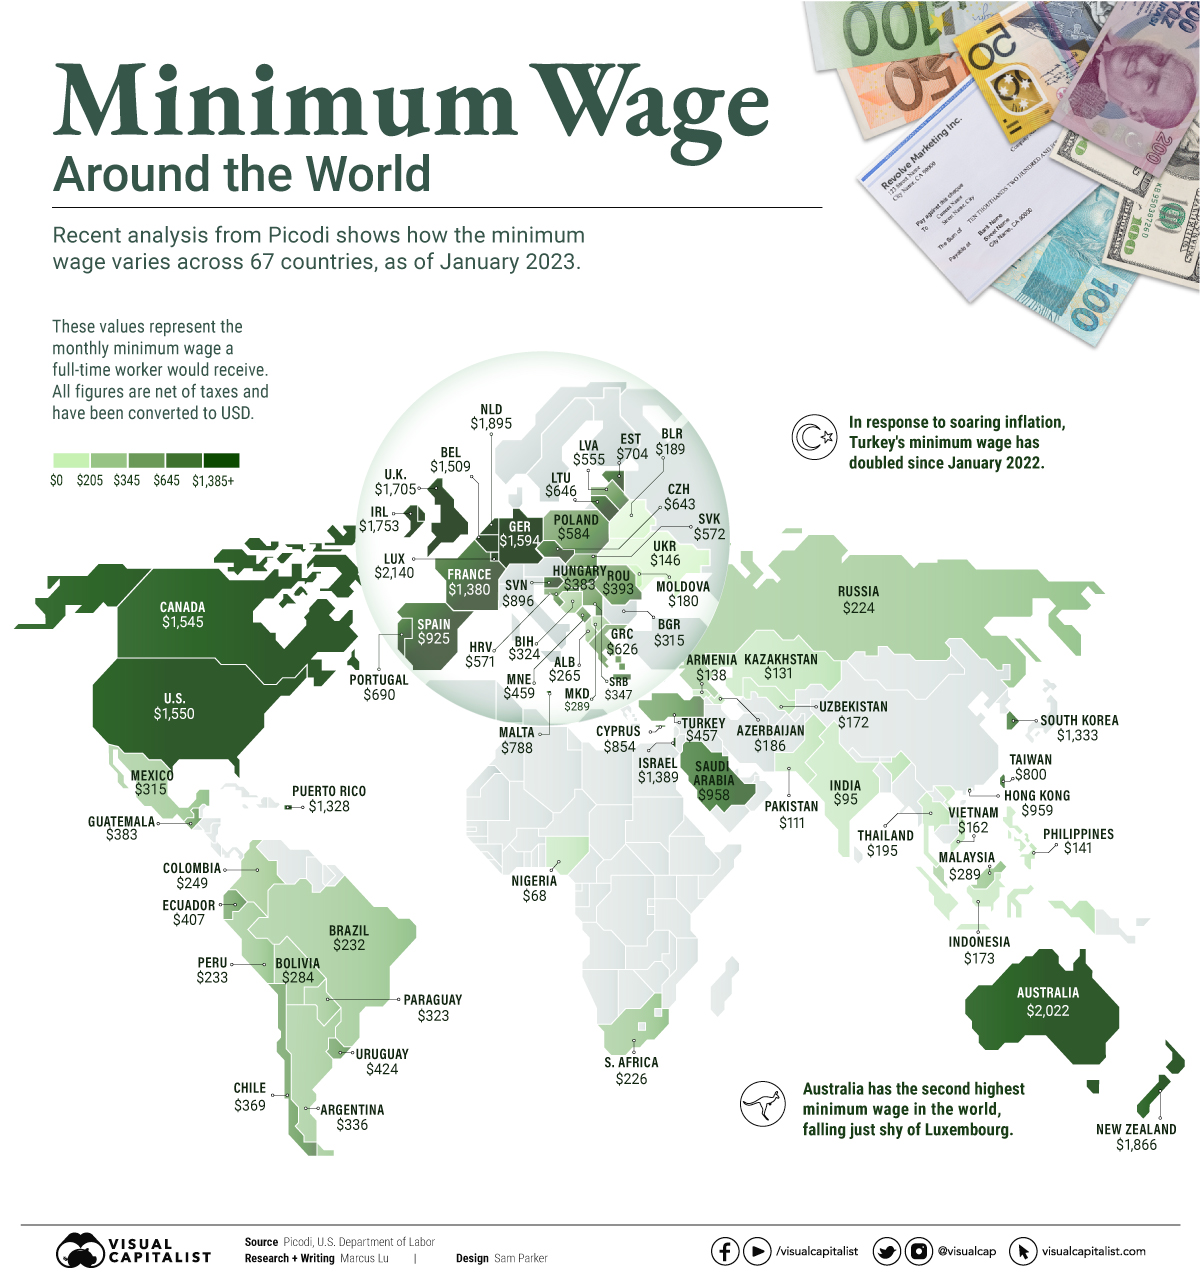
To see how the minimum wage differs around the world, we’ve visualized data from Picodi, which includes values for 67 countries as of January 2023.
Monthly Minimum Wage, by Country
The following table includes all of the data used in this infographic.
Each value represents the monthly minimum wage a full-time worker would receive in each country. Picodi states that these figures are net of taxes and have been converted to USD.
| Country | Increase compared to Jan 2022 | Minimum wage as of Jan 2023 (full-time, USD) |
|---|---|---|
| Argentina | 104.5% | $336 |
| Turkey | 100.0% | $457 |
| Moldova | 32.5% | $180 |
| Latvia | 27.1% | $555 |
| Malaysia | 25.8% | $289 |
| Pakistan | 24.6% | $111 |
| Romania | 24.5% | $393 |
| Germany | 21.9% | $1,594 |
| Belarus | 21.2% | $189 |
| Lithuania | 18.8% | $646 |
| North Macedonia | 18.5% | $298 |
| Mexico | 17.4% | $315 |
| Chile | 17.1% | $369 |
| Russia | 16.9% | $224 |
| Kazakhstan | 16.6% | $131 |
| Colombia | 16.4% | $249 |
| Hungary | 16.0% | $383 |
| Netherlands | 15.3% | $1,895 |
| Poland | 14.6% | $584 |
| Belgium | 14.3% | $1,509 |
| Serbia | 14.3% | $347 |
| Estonia | 14.2% | $704 |
| Azerbaijan | 14.2% | $186 |
| Albania | 13.3% | $265 |
| Slovenia | 12.9% | $896 |
| US | 12.6% | $1,550 |
| Croatia | 12.0% | $571 |
| Uzbekistan | 11.9% | $72 |
| Paraguay | 11.4% | $323 |
| Armenia | 11.4% | $138 |
| Peru | 10.3% | $233 |
| Bosnia and Herzegovina | 10.0% | $324 |
| Bulgaria | 9.9% | $315 |
| Luxembourg | 9.3% | $2,140 |
| Philippines | 9.2% | $141 |
| Uruguay | 9.0% | $424 |
| Brazil | 8.9% | $232 |
| India | 8.5% | $95 |
| Indonesia | 8.1% | $173 |
| Greece | 7.9% | $626 |
| Portugal | 7.8% | $690 |
| UK | 7.3% | $1,705 |
| Slovakia | 7.2% | $572 |
| South Africa | 6.9% | $226 |
| France | 6.6% | $1,380 |
| Czechia | 6.6% | $643 |
| Vietnam | 6.0% | $162 |
| Ecuador | 5.7% | $407 |
| New Zealand | 5.6% | $1,866 |
| Ireland | 5.4% | $1,753 |
| Canada | 5.1% | $1,545 |
| Thailand | 5.0% | $195 |
| Australia | 4.8% | $2,022 |
| South Korea | 4.7% | $1,333 |
| Taiwan | 4.6% | $800 |
| Bolivia | 4.0% | $284 |
| Guatemala | 3.9% | $383 |
| Malta | 3.6% | $788 |
| Ukraine | 3.1% | $146 |
| Israel | 0.0% | $1,389 |
| Puerto Rico | 0.0% | $1,328 |
| Hong Kong | 0.0% | $959 |
| Saudi Arabia | 0.0% | $958 |
| Spain | 0.0% | $925 |
| Montenegro | 0.0% | $459 |
| Nigeria | 0.0% | $68 |
| Cyprus | -- | $854 |
Generally speaking, developed countries have a higher cost of living, and thus require a higher minimum wage.
Two outliers in this dataset are Argentina and Turkey, which have increased their minimum wages by 100% or more from January 2022 levels.
Turkey is suffering from an ongoing currency crisis, with the lira losing over 40% of its value in 2021. Prices of basic goods have increased considerably as the Turkish lira continues to plummet. In fact, a 2022 survey found that 70% of people in Turkey were struggling to pay for food.
Argentina, South America’s second-biggest economy, is also suffering from very high inflation. In response, the country announced three minimum wage increases throughout 2022.
Minimum Wage in the U.S.
Within the U.S., minimum wage varies significantly by state. We’ve visualized each state’s basic minimum rate (hourly) using January 2023 data from the U.S. Department of Labor.

2023-03-17 Update: This map was updated to fix several incorrect values. We apologize for any confusion this may have caused.
America’s federal minimum wage has remained unchanged since 2009 at $7.25 per hour.
Each state is allowed to set their own minimum wage, as long as it’s higher than the federal minimum. In states that do not set their own minimum, the federal minimum applies.
If we assume someone works 40 hours a week, the federal minimum wage of $7.25 translates to an annual figure of just $15,080 before taxes. California’s minimum wage of $15.50 translates to $32,240 before taxes.
For further perspective, check out our 2022 infographic on the salary needed to buy a home across 50 U.S. cities.


Wealth
Visualizing the Tax Burden of Every U.S. State
Tax burden measures the percent of an individual’s income that is paid towards taxes. See where it’s the highest by state in this graphic.


Visualizing the Tax Burden of Every U.S. State
This was originally posted on our Voronoi app. Download the app for free on iOS or Android and discover incredible data-driven charts from a variety of trusted sources.
This map graphic visualizes the total tax burden in each U.S. state as of March 2024, based on figures compiled by WalletHub.
It’s important to understand that under this methodology, the tax burden measures the percent of an average person’s income that is paid towards state and local taxes. It considers property taxes, income taxes, and sales & excise tax.
Data and Methodology
The figures we used to create this graphic are listed in the table below.
| State | Total Tax Burden |
|---|---|
| New York | 12.0% |
| Hawaii | 11.8% |
| Vermont | 11.1% |
| Maine | 10.7% |
| California | 10.4% |
| Connecticut | 10.1% |
| Minnesota | 10.0% |
| Illinois | 9.7% |
| New Jersey | 9.5% |
| Rhode Island | 9.4% |
| Utah | 9.4% |
| Kansas | 9.3% |
| Maryland | 9.3% |
| Iowa | 9.2% |
| Nebraska | 9.2% |
| Ohio | 8.9% |
| Indiana | 8.9% |
| Arkansas | 8.8% |
| Mississippi | 8.8% |
| Massachusetts | 8.6% |
| Virginia | 8.5% |
| West Virginia | 8.5% |
| Oregon | 8.4% |
| Colorado | 8.4% |
| Pennsylvania | 8.4% |
| Wisconsin | 8.3% |
| Louisiana | 8.3% |
| Kentucky | 8.3% |
| Washington | 8.0% |
| New Mexico | 8.0% |
| Michigan | 8.0% |
| North Carolina | 7.9% |
| Idaho | 7.9% |
| Arizona | 7.8% |
| Missouri | 7.8% |
| Georgia | 7.7% |
| Texas | 7.6% |
| Alabama | 7.5% |
| Montana | 7.5% |
| South Carolina | 7.5% |
| Nevada | 7.4% |
| Oklahoma | 7.0% |
| North Dakota | 6.8% |
| South Dakota | 6.4% |
| Delaware | 6.4% |
| Tennessee | 6.1% |
| Florida | 6.1% |
| Wyoming | 5.7% |
| New Hampshire | 5.6% |
| Alaska | 4.9% |
From this data we can see that New York has the highest total tax burden. Residents in this state will pay, on average, 12% of their income to state and local governments.
Breaking this down into its three components, the average New Yorker pays 4.6% of their income on income taxes, 4.4% on property taxes, and 3% in sales & excise taxes.
At the other end of the spectrum, Alaska has the lowest tax burden of any state, equaling 4.9% of income. This is partly due to the fact that Alaskans do not pay state income tax.
Hate Paying Taxes?
In addition to Alaska, there are several other U.S. states that don’t charge income taxes. These are: Florida, Nevada, South Dakota, Tennessee, Texas, Washington, and Wyoming.
It’s also worth noting that New Hampshire does not have a regular income tax, but does charge a flat 4% on interest and dividend income according to the Tax Foundation.
Learn More About Taxation From Visual Capitalist
If you enjoyed this post, be sure to check out this graphic which ranks the countries with the lowest corporate tax rates, from 1980 to today.

-

 Brands5 days ago
The Evolution of U.S. Beer Logos
-

 Culture2 weeks ago
The World’s Top Media Franchises by All-Time Revenue
-

 Best of2 weeks ago
Best Visualizations of April on the Voronoi App
-

 Wealth2 weeks ago
Charted: Which Country Has the Most Billionaires in 2024?
-

 Business1 week ago
The Top Private Equity Firms by Country
-

 Markets1 week ago
The Best U.S. Companies to Work for According to LinkedIn
-

 Economy1 week ago
Ranked: The Top 20 Countries in Debt to China
-

 United States1 week ago
Charted: Trust in Government Institutions by G7 Countries