Markets
Charting the Rise and Fall of the Global Luxury Goods Market


The Rise and Fall of the Global Luxury Goods Market
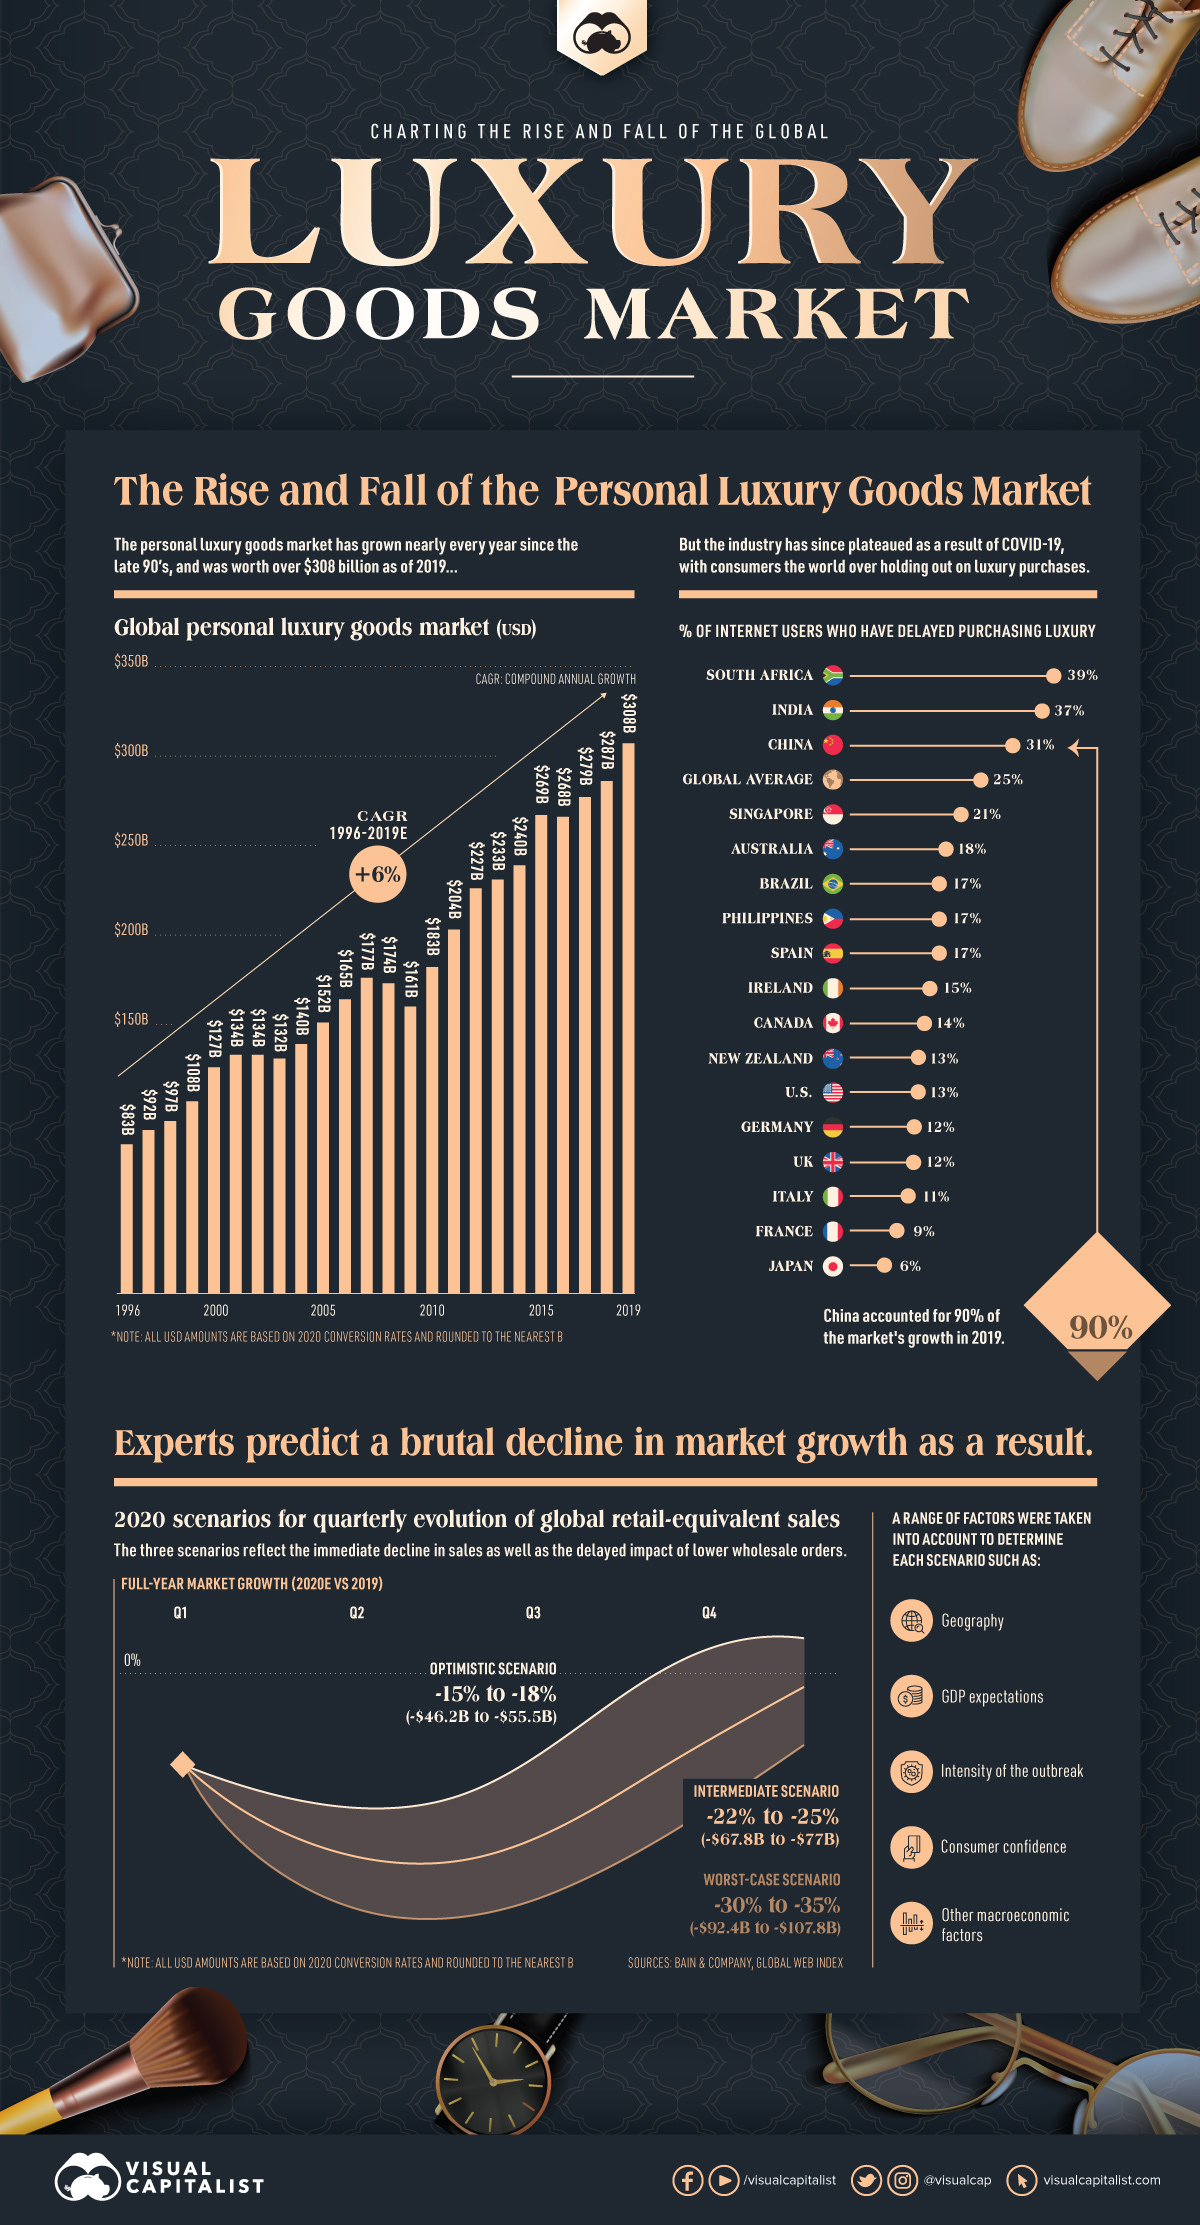
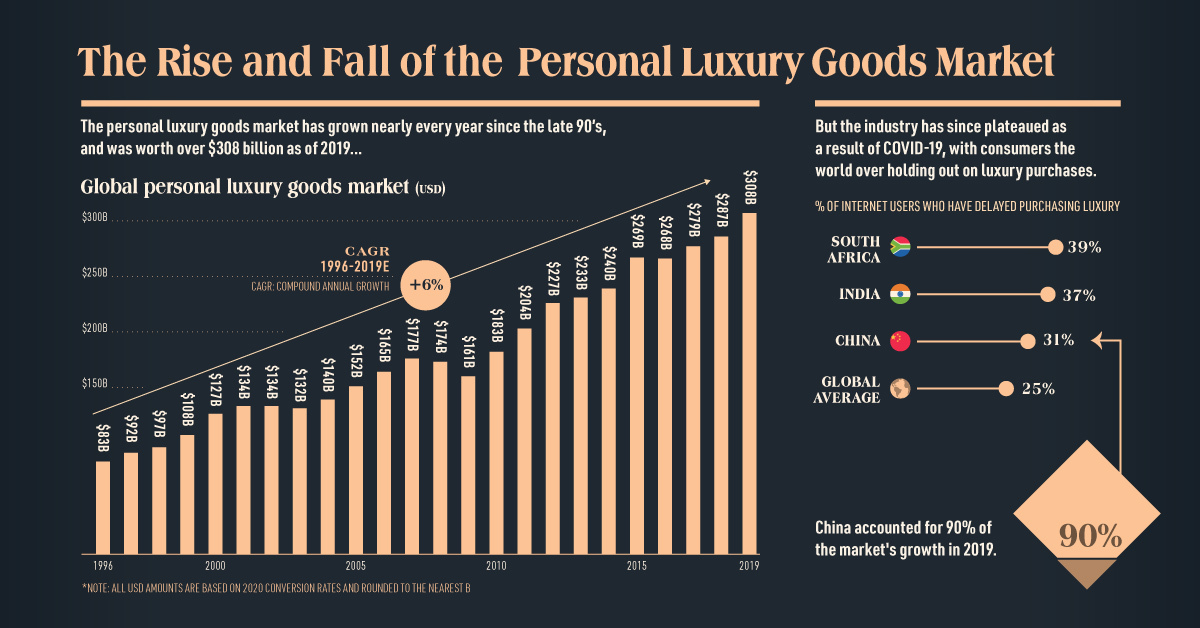
Global demand for personal luxury goods has been steadily increasing for decades, resulting in an industry worth $308 billion in 2019.
However, the insatiable desire for consumers to own nice things was suddenly interrupted by the coming of COVID-19, and experts are predicting a brutal contraction of up to one-third of the current luxury good market size this year.
Will the industry bounce back? Or will it return as something noticeably different?
A Once Promising Trajectory
The global luxury goods market—which includes beauty, apparel, and accessories—has compounded at a 6% pace since the 1990s.
Recent years of growth in the personal luxury goods market can be mostly attributed to Chinese consumers. This geographic market accounted for 90% of total sales growth in 2019, followed by the Europe and the Americas.
Analysts suggest that China’s younger luxury goods consumers in particular have significant spending power, with an average spend of $6,000 (¥41,000) per person in pre-COVID times.
An Industry Now in Distress
The lethal combination of reduced foot traffic and decreased consumer spending in the first quarter of 2020 has brought the retail industry to its knees.
In fact, more than 80% of fashion and luxury players will experience financial distress as a result of extended store closures.
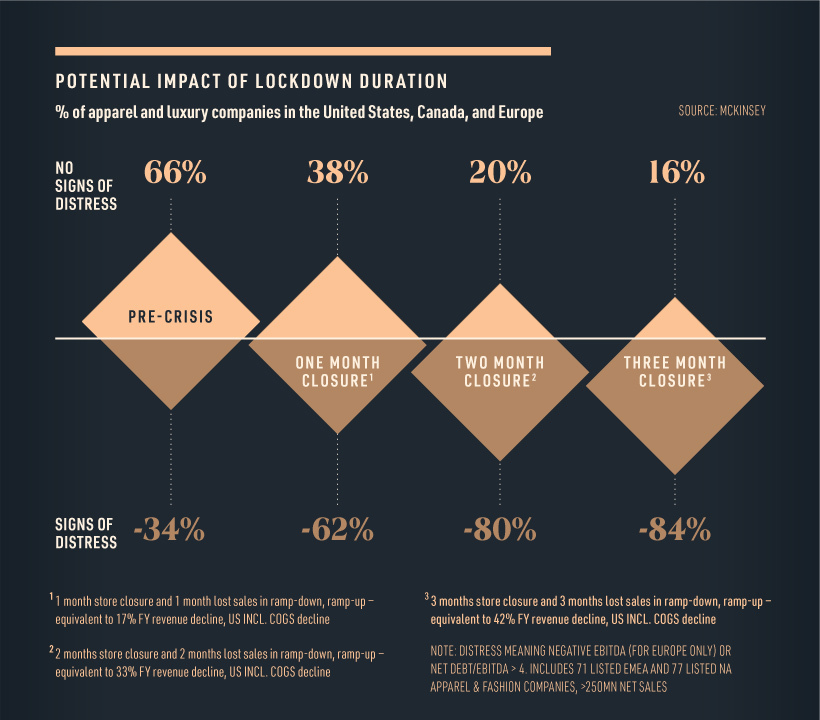
With iconic luxury retailers such as Neiman Marcus filing for bankruptcy, the pressure on the luxury industry is clear. It should be noted however, that companies who were experiencing distress before the COVID-19 outbreak will be the hardest hit.
Predicting the Collapse
In a recent report, Bain & Company estimated a 25% to 30% global luxury market contraction for the first quarter of 2020 based on several economic variables. They have also modeled three scenarios to predict the performance for the remainder of 2020.
- Optimistic scenario: A limited market contraction of 15% to 18%, assuming increased consumer demand for the second and third quarter of the year, roughly equating to a sales decline of $46 billion to $56 billion.
- Intermediate scenario: A moderate market contraction of between 22% and 25%, or $68 to $77 billion.
- Worst-case scenario: A steep contraction of between 30% and 35%, equating to $92 billion to $108 billion. This assumes a longer period of sales decline.
Although there are signs of recovery in China, the industry is not expected to fully return to 2019 levels until 2022 at the earliest. By that stage, the industry could have transformed entirely.
Changing Consumer Mindsets
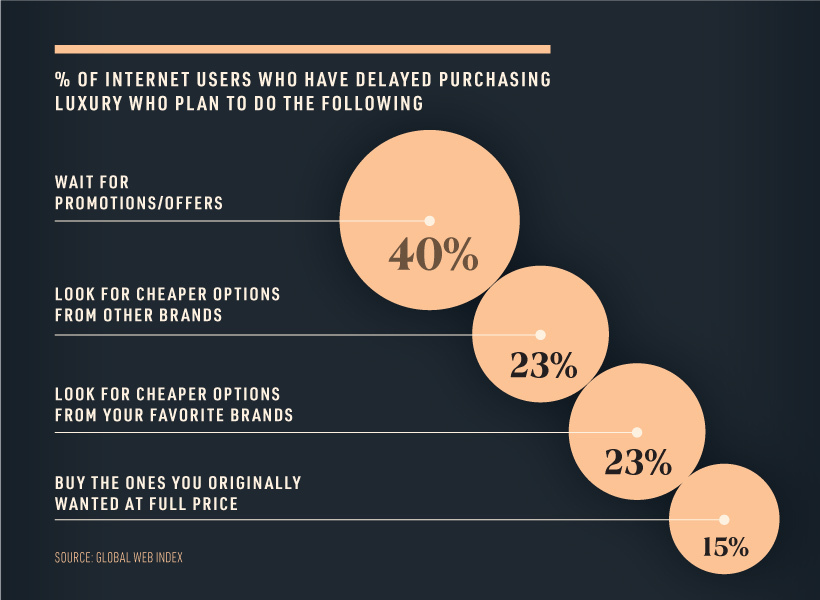
Since the beginning of the pandemic, one-quarter of consumers have delayed purchasing luxury items. In fact, a portion of those who have delayed purchasing luxury goods are now considering entirely new avenues, such as seeking out cheaper alternatives.
However, most people surveyed claim that they will postpone buying luxury items until they can get a better deal on price.
This frugal mindset could spark an interesting behavioral shift, and set the stage for a new category to emerge from the ashes—the second-hand luxury market.
Numerous sources claim that pre-owned luxury could in fact overtake the traditional luxury market, and the pandemic economy could very well be a tipping point.
The Future of Luxury
Medium-term market growth could be driven by a number of factors, from a global growing middle class and their demand for luxury products, as well as retailers’ sudden shift to e-commerce.
While analysts can only rely on predictions to determine the future of personal luxury, it is clear that the industry is at a crossroads.


Markets
Mapped: Europe’s GDP Per Capita, by Country
Which European economies are richest on a GDP per capita basis? This map shows the results for 44 countries across the continent.


Mapped: Europe’s GDP Per Capita, by Country (2024)
This was originally posted on our Voronoi app. Download the app for free on iOS or Android and discover incredible data-driven charts from a variety of trusted sources.
Europe is home to some of the largest and most sophisticated economies in the world. But how do countries in the region compare with each other on a per capita productivity basis?
In this map, we show Europe’s GDP per capita levels across 44 nations in current U.S. dollars. Data for this visualization and article is sourced from the International Monetary Fund (IMF) via their DataMapper tool, updated April 2024.
Europe’s Richest and Poorest Nations, By GDP Per Capita
Luxembourg, Ireland, and Switzerland, lead the list of Europe’s richest nations by GDP per capita, all above $100,000.
| Rank | Country | GDP Per Capita (2024) |
|---|---|---|
| 1 | 🇱🇺 Luxembourg | $131,380 |
| 2 | 🇮🇪 Ireland | $106,060 |
| 3 | 🇨🇭 Switzerland | $105,670 |
| 4 | 🇳🇴 Norway | $94,660 |
| 5 | 🇮🇸 Iceland | $84,590 |
| 6 | 🇩🇰 Denmark | $68,900 |
| 7 | 🇳🇱 Netherlands | $63,750 |
| 8 | 🇸🇲 San Marino | $59,410 |
| 9 | 🇦🇹 Austria | $59,230 |
| 10 | 🇸🇪 Sweden | $58,530 |
| 11 | 🇧🇪 Belgium | $55,540 |
| 12 | 🇫🇮 Finland | $55,130 |
| 13 | 🇩🇪 Germany | $54,290 |
| 14 | 🇬🇧 UK | $51,070 |
| 15 | 🇫🇷 France | $47,360 |
| 16 | 🇦🇩 Andorra | $44,900 |
| 17 | 🇲🇹 Malta | $41,740 |
| 18 | 🇮🇹 Italy | $39,580 |
| 19 | 🇨🇾 Cyprus | $37,150 |
| 20 | 🇪🇸 Spain | $34,050 |
| 21 | 🇸🇮 Slovenia | $34,030 |
| 22 | 🇪🇪 Estonia | $31,850 |
| 23 | 🇨🇿 Czech Republic | $29,800 |
| 24 | 🇵🇹 Portugal | $28,970 |
| 25 | 🇱🇹 Lithuania | $28,410 |
| 26 | 🇸🇰 Slovakia | $25,930 |
| 27 | 🇱🇻 Latvia | $24,190 |
| 28 | 🇬🇷 Greece | $23,970 |
| 29 | 🇭🇺 Hungary | $23,320 |
| 30 | 🇵🇱 Poland | $23,010 |
| 31 | 🇭🇷 Croatia | $22,970 |
| 32 | 🇷🇴 Romania | $19,530 |
| 33 | 🇧🇬 Bulgaria | $16,940 |
| 34 | 🇷🇺 Russia | $14,390 |
| 35 | 🇹🇷 Türkiye | $12,760 |
| 36 | 🇲🇪 Montenegro | $12,650 |
| 37 | 🇷🇸 Serbia | $12,380 |
| 38 | 🇦🇱 Albania | $8,920 |
| 39 | 🇧🇦 Bosnia & Herzegovina | $8,420 |
| 40 | 🇲🇰 North Macedonia | $7,690 |
| 41 | 🇧🇾 Belarus | $7,560 |
| 42 | 🇲🇩 Moldova | $7,490 |
| 43 | 🇽🇰 Kosovo | $6,390 |
| 44 | 🇺🇦 Ukraine | $5,660 |
| N/A | 🇪🇺 EU Average | $44,200 |
Note: Figures are rounded.
Three Nordic countries (Norway, Iceland, Denmark) also place highly, between $70,000-90,000. Other Nordic peers, Sweden and Finland rank just outside the top 10, between $55,000-60,000.
Meanwhile, Europe’s biggest economies in absolute terms, Germany, UK, and France, rank closer to the middle of the top 20, with GDP per capitas around $50,000.
Finally, at the end of the scale, Eastern Europe as a whole tends to have much lower per capita GDPs. In that group, Ukraine ranks last, at $5,660.
A Closer Look at Ukraine
For a broader comparison, Ukraine’s per capita GDP is similar to Iran ($5,310), El Salvador ($5,540), and Guatemala ($5,680).
According to experts, Ukraine’s economy has historically underperformed to expectations. After the fall of the Berlin Wall, the economy contracted for five straight years. Its transition to a Western, liberalized economic structure was overshadowed by widespread corruption, a limited taxpool, and few revenue sources.
Politically, its transformation from authoritarian regime to civil democracy has proved difficult, especially when it comes to institution building.
Finally, after the 2022 invasion of the country, Ukraine’s GDP contracted by 30% in a single year—the largest loss since independence. Large scale emigration—to the tune of six million refugees—is also playing a role.
Despite these challenges, the country’s economic growth has somewhat stabilized while fighting continues.

-

 Markets5 days ago
Visualizing Global Inflation Forecasts (2024-2026)
-

 Green2 weeks ago
The Carbon Footprint of Major Travel Methods
-

 United States2 weeks ago
Visualizing the Most Common Pets in the U.S.
-

 Culture2 weeks ago
The World’s Top Media Franchises by All-Time Revenue
-

 voronoi1 week ago
Best Visualizations of April on the Voronoi App
-

 Wealth1 week ago
Charted: Which Country Has the Most Billionaires in 2024?
-

 Business1 week ago
The Top Private Equity Firms by Country
-

 Markets1 week ago
The Best U.S. Companies to Work for According to LinkedIn