Markets
Swiss Watches: Market Share by Brand in 2023
![]() See this visualization first on the Voronoi app.
See this visualization first on the Voronoi app.
Swiss Watches: Market Share by Brand in 2023
This was originally posted on our Voronoi app. Download the app for free on iOS or Android and discover incredible data-driven charts from a variety of trusted sources.
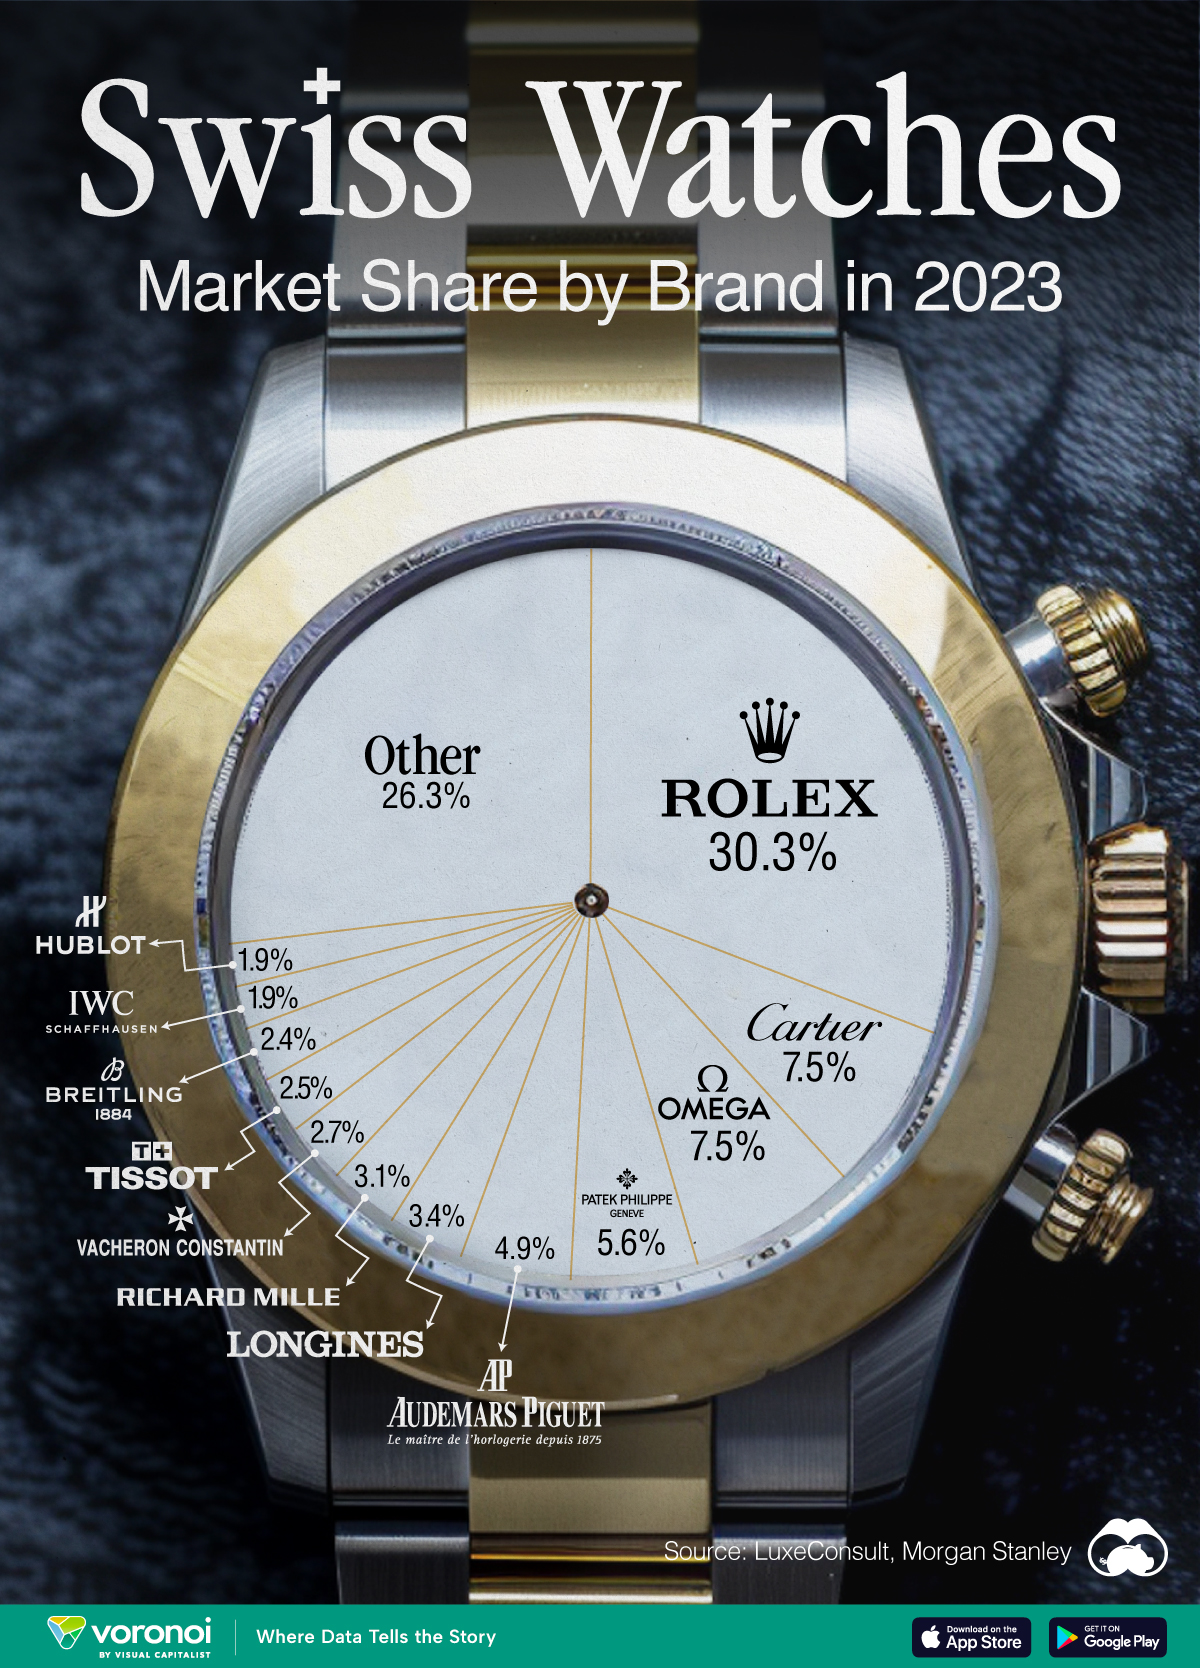
Swiss watches are renowned for their precision, craftsmanship, and quality. In this visualization, we rank the top Swiss watch brands based on their estimated 2023 market share, which comes from data provided by LuxeConsult and Morgan Stanley.
Rolex Dominates the Swiss Watch Market
Sales of Rolex watches are believed to have surpassed 10 billion Swiss francs ($11.2 billion) for the first time in 2023, significantly outpacing rivals like Cartier CHF 3.1 billion ($3.5 billion) and Omega CHF 2.6 billion ($2.9 billion).
Additionally, Rolex has strengthened its dominant position in the market, capturing a remarkable 30.3% retail market share.
| Brand | Market Share (%) |
|---|---|
| Rolex | 30.3 |
| Cartier | 7.5 |
| Omega | 7.5 |
| Patek Philippe | 5.6 |
| Audemars Piguet | 4.9 |
| Longines | 3.4 |
| Richard Mille | 3.1 |
| Vacheron Constantin | 2.7 |
| Tissot | 2.5 |
| Breitling | 2.4 |
| IWC | 1.9 |
| Hublot | 1.9 |
| Jaeger-LeCoultre | 1.7 |
| TAG Heur | 1.7 |
| Other | 22.9 |
In 2023, the Swiss watch industry achieved record sales totaling CHF 26.7 billion ($30 billion). The “Big Four” watch brands—Rolex, Patek Philippe, Audemars Piguet, and Richard Mille—achieved a combined 43.9% market share last year, compared to a pre-Covid 2019 market share of 36.9%.
Also noteworthy is that Vacheron Constantin joined the billionaires’ club as the 8th brand to surpass CHF 1 billion in sales, reaching CHF 1.097 billion ($1.23 billion).
In conclusion, premium watches priced over CHF 25,000 ($28,000) drove 69% of the market’s growth in 2023, and constituted 44% of the total value of Swiss watch exports. Despite this significant value contribution, this segment represents only 2.5% of the total volume in terms of units sold.
See Related Infographics
If you enjoyed this content, check out The World’s Biggest Fashion Companies by Market Cap, or Ranked: Gen Z’s Favorite Brands in 2023.


Markets
Mapped: Europe’s GDP Per Capita, by Country
Which European economies are richest on a GDP per capita basis? This map shows the results for 44 countries across the continent.


Mapped: Europe’s GDP Per Capita, by Country (2024)
This was originally posted on our Voronoi app. Download the app for free on iOS or Android and discover incredible data-driven charts from a variety of trusted sources.
Europe is home to some of the largest and most sophisticated economies in the world. But how do countries in the region compare with each other on a per capita productivity basis?
In this map, we show Europe’s GDP per capita levels across 44 nations in current U.S. dollars. Data for this visualization and article is sourced from the International Monetary Fund (IMF) via their DataMapper tool, updated April 2024.
Europe’s Richest and Poorest Nations, By GDP Per Capita
Luxembourg, Ireland, and Switzerland, lead the list of Europe’s richest nations by GDP per capita, all above $100,000.
| Rank | Country | GDP Per Capita (2024) |
|---|---|---|
| 1 | 🇱🇺 Luxembourg | $131,380 |
| 2 | 🇮🇪 Ireland | $106,060 |
| 3 | 🇨🇭 Switzerland | $105,670 |
| 4 | 🇳🇴 Norway | $94,660 |
| 5 | 🇮🇸 Iceland | $84,590 |
| 6 | 🇩🇰 Denmark | $68,900 |
| 7 | 🇳🇱 Netherlands | $63,750 |
| 8 | 🇸🇲 San Marino | $59,410 |
| 9 | 🇦🇹 Austria | $59,230 |
| 10 | 🇸🇪 Sweden | $58,530 |
| 11 | 🇧🇪 Belgium | $55,540 |
| 12 | 🇫🇮 Finland | $55,130 |
| 13 | 🇩🇪 Germany | $54,290 |
| 14 | 🇬🇧 UK | $51,070 |
| 15 | 🇫🇷 France | $47,360 |
| 16 | 🇦🇩 Andorra | $44,900 |
| 17 | 🇲🇹 Malta | $41,740 |
| 18 | 🇮🇹 Italy | $39,580 |
| 19 | 🇨🇾 Cyprus | $37,150 |
| 20 | 🇪🇸 Spain | $34,050 |
| 21 | 🇸🇮 Slovenia | $34,030 |
| 22 | 🇪🇪 Estonia | $31,850 |
| 23 | 🇨🇿 Czech Republic | $29,800 |
| 24 | 🇵🇹 Portugal | $28,970 |
| 25 | 🇱🇹 Lithuania | $28,410 |
| 26 | 🇸🇰 Slovakia | $25,930 |
| 27 | 🇱🇻 Latvia | $24,190 |
| 28 | 🇬🇷 Greece | $23,970 |
| 29 | 🇭🇺 Hungary | $23,320 |
| 30 | 🇵🇱 Poland | $23,010 |
| 31 | 🇭🇷 Croatia | $22,970 |
| 32 | 🇷🇴 Romania | $19,530 |
| 33 | 🇧🇬 Bulgaria | $16,940 |
| 34 | 🇷🇺 Russia | $14,390 |
| 35 | 🇹🇷 Türkiye | $12,760 |
| 36 | 🇲🇪 Montenegro | $12,650 |
| 37 | 🇷🇸 Serbia | $12,380 |
| 38 | 🇦🇱 Albania | $8,920 |
| 39 | 🇧🇦 Bosnia & Herzegovina | $8,420 |
| 40 | 🇲🇰 North Macedonia | $7,690 |
| 41 | 🇧🇾 Belarus | $7,560 |
| 42 | 🇲🇩 Moldova | $7,490 |
| 43 | 🇽🇰 Kosovo | $6,390 |
| 44 | 🇺🇦 Ukraine | $5,660 |
| N/A | 🇪🇺 EU Average | $44,200 |
Note: Figures are rounded.
Three Nordic countries (Norway, Iceland, Denmark) also place highly, between $70,000-90,000. Other Nordic peers, Sweden and Finland rank just outside the top 10, between $55,000-60,000.
Meanwhile, Europe’s biggest economies in absolute terms, Germany, UK, and France, rank closer to the middle of the top 20, with GDP per capitas around $50,000.
Finally, at the end of the scale, Eastern Europe as a whole tends to have much lower per capita GDPs. In that group, Ukraine ranks last, at $5,660.
A Closer Look at Ukraine
For a broader comparison, Ukraine’s per capita GDP is similar to Iran ($5,310), El Salvador ($5,540), and Guatemala ($5,680).
According to experts, Ukraine’s economy has historically underperformed to expectations. After the fall of the Berlin Wall, the economy contracted for five straight years. Its transition to a Western, liberalized economic structure was overshadowed by widespread corruption, a limited taxpool, and few revenue sources.
Politically, its transformation from authoritarian regime to civil democracy has proved difficult, especially when it comes to institution building.
Finally, after the 2022 invasion of the country, Ukraine’s GDP contracted by 30% in a single year—the largest loss since independence. Large scale emigration—to the tune of six million refugees—is also playing a role.
Despite these challenges, the country’s economic growth has somewhat stabilized while fighting continues.

-

 Markets5 days ago
Visualizing Global Inflation Forecasts (2024-2026)
-

 Green2 weeks ago
The Carbon Footprint of Major Travel Methods
-

 United States2 weeks ago
Visualizing the Most Common Pets in the U.S.
-

 Culture2 weeks ago
The World’s Top Media Franchises by All-Time Revenue
-

 voronoi1 week ago
Best Visualizations of April on the Voronoi App
-

 Wealth1 week ago
Charted: Which Country Has the Most Billionaires in 2024?
-

 Business1 week ago
The Top Private Equity Firms by Country
-

 Markets1 week ago
The Best U.S. Companies to Work for According to LinkedIn