Markets
Ranking the Largest Companies by Revenue: USA vs. China
![]() See this visualization first on the Voronoi app.
See this visualization first on the Voronoi app.
Comparing the Largest American and Chinese Companies
This was originally posted on our Voronoi app. Download the app for free on iOS or Android and discover incredible data-driven charts from a variety of trusted sources.
With a GDP of around $18 trillion, China boasts the world’s second-largest economy, trailing only the United States.
The combination of low labor costs and advanced technology has positioned China as the global manufacturing hub.
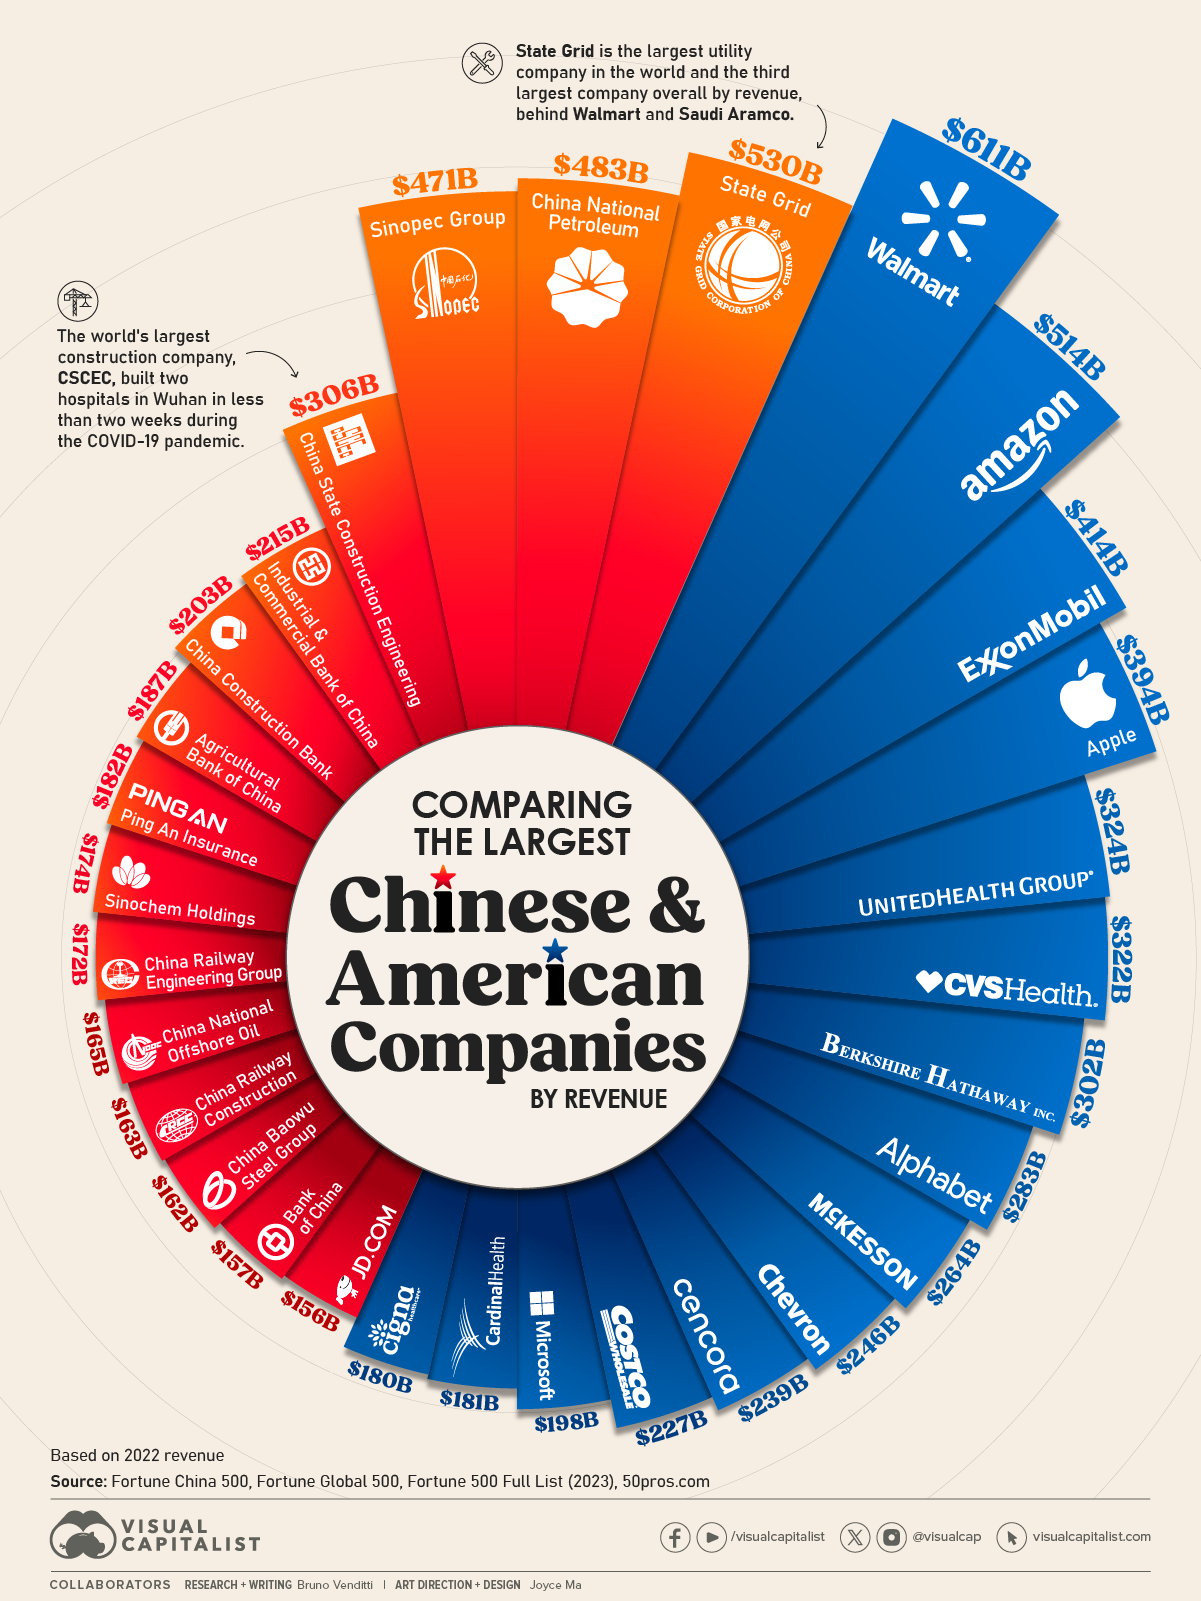
In this graphic, we compare the 15 largest Chinese and American companies based on their 2022 revenue, using data from the Fortune China 500 and Fortune Global 500.
Chinese State-Owned Giants
Not as well-known in Western countries as brands like Walmart, Amazon, or Apple, China’s largest companies rank among the world’s top in terms of revenue.
China’s biggest company, the utility giant State Grid, is the third-largest company by revenue globally, trailing only Walmart and Saudi Aramco.
| Company | Industry | 2022 Revenue (USD billion) |
|---|---|---|
| 🇺🇸 Walmart | Retailer | $611B |
| 🇨🇳 State Grid | Utility | $530B |
| 🇺🇸 Amazon | Retailer | $514B |
| 🇨🇳 China National Petroleum | Oil and Gas | $483B |
| 🇨🇳 Sinopec Group | Oil and Gas | $471B |
| 🇺🇸 Exxon Mobil | Oil and Gas | $413B |
| 🇺🇸 Apple | Electronics | $394B |
| 🇺🇸 Berkshire Hathaway | Insurance/ Property and Casualty (Stock) | $383B |
| 🇺🇸 UnitedHealth Group | Insurance/ Health Care | $324B |
| 🇺🇸 CVS Health | Health Care/ Pharmacy | $322B |
| 🇨🇳 China State Construction Engineering | Construction | $306B |
| 🇺🇸 Alphabet | Internet Services/ Retail | $283B |
| 🇺🇸 McKesson | Health Care / Pharmacy | $264B |
| 🇺🇸 Chevron | Petroil Refining | $246B |
| 🇺🇸 Cencora | Health Care | $238B |
| 🇺🇸 Costco Wholesale | General Merchandisers | $227B |
| 🇺🇸 Microsoft | Computer Software | $227B |
| 🇨🇳 Industrial & Commercial Bank of China | Banking/Financial | $215B |
| 🇨🇳 China Construction Bank | Banking/Financial | $203B |
| 🇨🇳 Agricultural Bank of China | Banking/Financial | $187B |
| 🇨🇳 Ping An Insurance | Banking / Insurance | $182B |
| 🇺🇸 Cardinal Health | Health Care | $181B |
| 🇺🇸 Cigna | Health Care / Insurance | $180B |
| 🇨🇳 Sinochem Holdings | Chemicals / Fertilizer | $174B |
| 🇨🇳 China Railway Engineering Group | Holding Company | $172B |
| 🇨🇳 China National Offshore Oil | Oil and Gas | $165B |
| 🇨🇳 China Railway Construction | Construction | $163B |
| 🇨🇳 China Baowu Steel Group | Steel/Metallurgy | $162B |
| 🇨🇳 Bank of China | Banking/Financial | $157B |
| 🇨🇳 JD.com | Retail | $155B |
State Grid holds the title of the largest utility company globally. In 2022, it reported 871,145 employees and served 1.1 billion customers.
Most of the leading Chinese companies on this ranking are similar to State Grid, in that they were initially founded as state-owned entities and operate in traditional industries like utilities, banking, construction, and oil and gas.
Another example is China State Construction Engineering, the world’s largest construction company, notable for constructing two hospitals in Wuhan in less than two weeks during the COVID-19 pandemic.
In contrast, the U.S. top 15 list leans more towards a presence of retail and technology companies.
One Chinese company that bucks the trends above is JD.com, a massive e-commerce company. Founded by internet entrepreneur Liu Qiangdong in 1998, JD.com initially started as an physical electronics store, but quickly expanded into e-commerce and diversified its product offering. Today, it stands as a major competitor to Alibaba’s Tmall.
China claims three spots in the top five overall, with oil and gas companies China National Petroleum and Sinopec Group leading ahead of companies like ExxonMobil, Apple, and Berkshire Hathaway.


Markets
Mapped: Europe’s GDP Per Capita, by Country
Which European economies are richest on a GDP per capita basis? This map shows the results for 44 countries across the continent.


Mapped: Europe’s GDP Per Capita, by Country (2024)
This was originally posted on our Voronoi app. Download the app for free on iOS or Android and discover incredible data-driven charts from a variety of trusted sources.
Europe is home to some of the largest and most sophisticated economies in the world. But how do countries in the region compare with each other on a per capita productivity basis?
In this map, we show Europe’s GDP per capita levels across 44 nations in current U.S. dollars. Data for this visualization and article is sourced from the International Monetary Fund (IMF) via their DataMapper tool, updated April 2024.
Europe’s Richest and Poorest Nations, By GDP Per Capita
Luxembourg, Ireland, and Switzerland, lead the list of Europe’s richest nations by GDP per capita, all above $100,000.
| Rank | Country | GDP Per Capita (2024) |
|---|---|---|
| 1 | 🇱🇺 Luxembourg | $131,380 |
| 2 | 🇮🇪 Ireland | $106,060 |
| 3 | 🇨🇭 Switzerland | $105,670 |
| 4 | 🇳🇴 Norway | $94,660 |
| 5 | 🇮🇸 Iceland | $84,590 |
| 6 | 🇩🇰 Denmark | $68,900 |
| 7 | 🇳🇱 Netherlands | $63,750 |
| 8 | 🇸🇲 San Marino | $59,410 |
| 9 | 🇦🇹 Austria | $59,230 |
| 10 | 🇸🇪 Sweden | $58,530 |
| 11 | 🇧🇪 Belgium | $55,540 |
| 12 | 🇫🇮 Finland | $55,130 |
| 13 | 🇩🇪 Germany | $54,290 |
| 14 | 🇬🇧 UK | $51,070 |
| 15 | 🇫🇷 France | $47,360 |
| 16 | 🇦🇩 Andorra | $44,900 |
| 17 | 🇲🇹 Malta | $41,740 |
| 18 | 🇮🇹 Italy | $39,580 |
| 19 | 🇨🇾 Cyprus | $37,150 |
| 20 | 🇪🇸 Spain | $34,050 |
| 21 | 🇸🇮 Slovenia | $34,030 |
| 22 | 🇪🇪 Estonia | $31,850 |
| 23 | 🇨🇿 Czech Republic | $29,800 |
| 24 | 🇵🇹 Portugal | $28,970 |
| 25 | 🇱🇹 Lithuania | $28,410 |
| 26 | 🇸🇰 Slovakia | $25,930 |
| 27 | 🇱🇻 Latvia | $24,190 |
| 28 | 🇬🇷 Greece | $23,970 |
| 29 | 🇭🇺 Hungary | $23,320 |
| 30 | 🇵🇱 Poland | $23,010 |
| 31 | 🇭🇷 Croatia | $22,970 |
| 32 | 🇷🇴 Romania | $19,530 |
| 33 | 🇧🇬 Bulgaria | $16,940 |
| 34 | 🇷🇺 Russia | $14,390 |
| 35 | 🇹🇷 Türkiye | $12,760 |
| 36 | 🇲🇪 Montenegro | $12,650 |
| 37 | 🇷🇸 Serbia | $12,380 |
| 38 | 🇦🇱 Albania | $8,920 |
| 39 | 🇧🇦 Bosnia & Herzegovina | $8,420 |
| 40 | 🇲🇰 North Macedonia | $7,690 |
| 41 | 🇧🇾 Belarus | $7,560 |
| 42 | 🇲🇩 Moldova | $7,490 |
| 43 | 🇽🇰 Kosovo | $6,390 |
| 44 | 🇺🇦 Ukraine | $5,660 |
| N/A | 🇪🇺 EU Average | $44,200 |
Note: Figures are rounded.
Three Nordic countries (Norway, Iceland, Denmark) also place highly, between $70,000-90,000. Other Nordic peers, Sweden and Finland rank just outside the top 10, between $55,000-60,000.
Meanwhile, Europe’s biggest economies in absolute terms, Germany, UK, and France, rank closer to the middle of the top 20, with GDP per capitas around $50,000.
Finally, at the end of the scale, Eastern Europe as a whole tends to have much lower per capita GDPs. In that group, Ukraine ranks last, at $5,660.
A Closer Look at Ukraine
For a broader comparison, Ukraine’s per capita GDP is similar to Iran ($5,310), El Salvador ($5,540), and Guatemala ($5,680).
According to experts, Ukraine’s economy has historically underperformed to expectations. After the fall of the Berlin Wall, the economy contracted for five straight years. Its transition to a Western, liberalized economic structure was overshadowed by widespread corruption, a limited taxpool, and few revenue sources.
Politically, its transformation from authoritarian regime to civil democracy has proved difficult, especially when it comes to institution building.
Finally, after the 2022 invasion of the country, Ukraine’s GDP contracted by 30% in a single year—the largest loss since independence. Large scale emigration—to the tune of six million refugees—is also playing a role.
Despite these challenges, the country’s economic growth has somewhat stabilized while fighting continues.

-

 Wealth6 days ago
Charted: What Frustrates Americans About the Tax System
-

 Mining2 weeks ago
Visualizing Global Gold Production in 2023
-

 Markets2 weeks ago
Visualized: Interest Rate Forecasts for Advanced Economies
-

 Economy2 weeks ago
The Most Valuable Companies in Major EU Economies
-

 Markets1 week ago
The World’s Fastest Growing Emerging Markets (2024-2029 Forecast)
-

 Markets1 week ago
Visualizing Global Inflation Forecasts (2024-2026)
-

 Misc1 week ago
Charted: What Southeast Asia Thinks About China & the U.S.
-

 Misc1 week ago
The Evolution of U.S. Beer Logos