Money
The World’s Top 50 Largest Banks by Consolidated Assets
![]() See this visualization first on the Voronoi app.
See this visualization first on the Voronoi app.
The World’s Top 50 Largest Banks by Consolidated Assets
This was originally posted on our Voronoi app. Download the app for free on iOS or Android and discover incredible data-driven charts from a variety of trusted sources.
Banks are often among the biggest companies in the world.
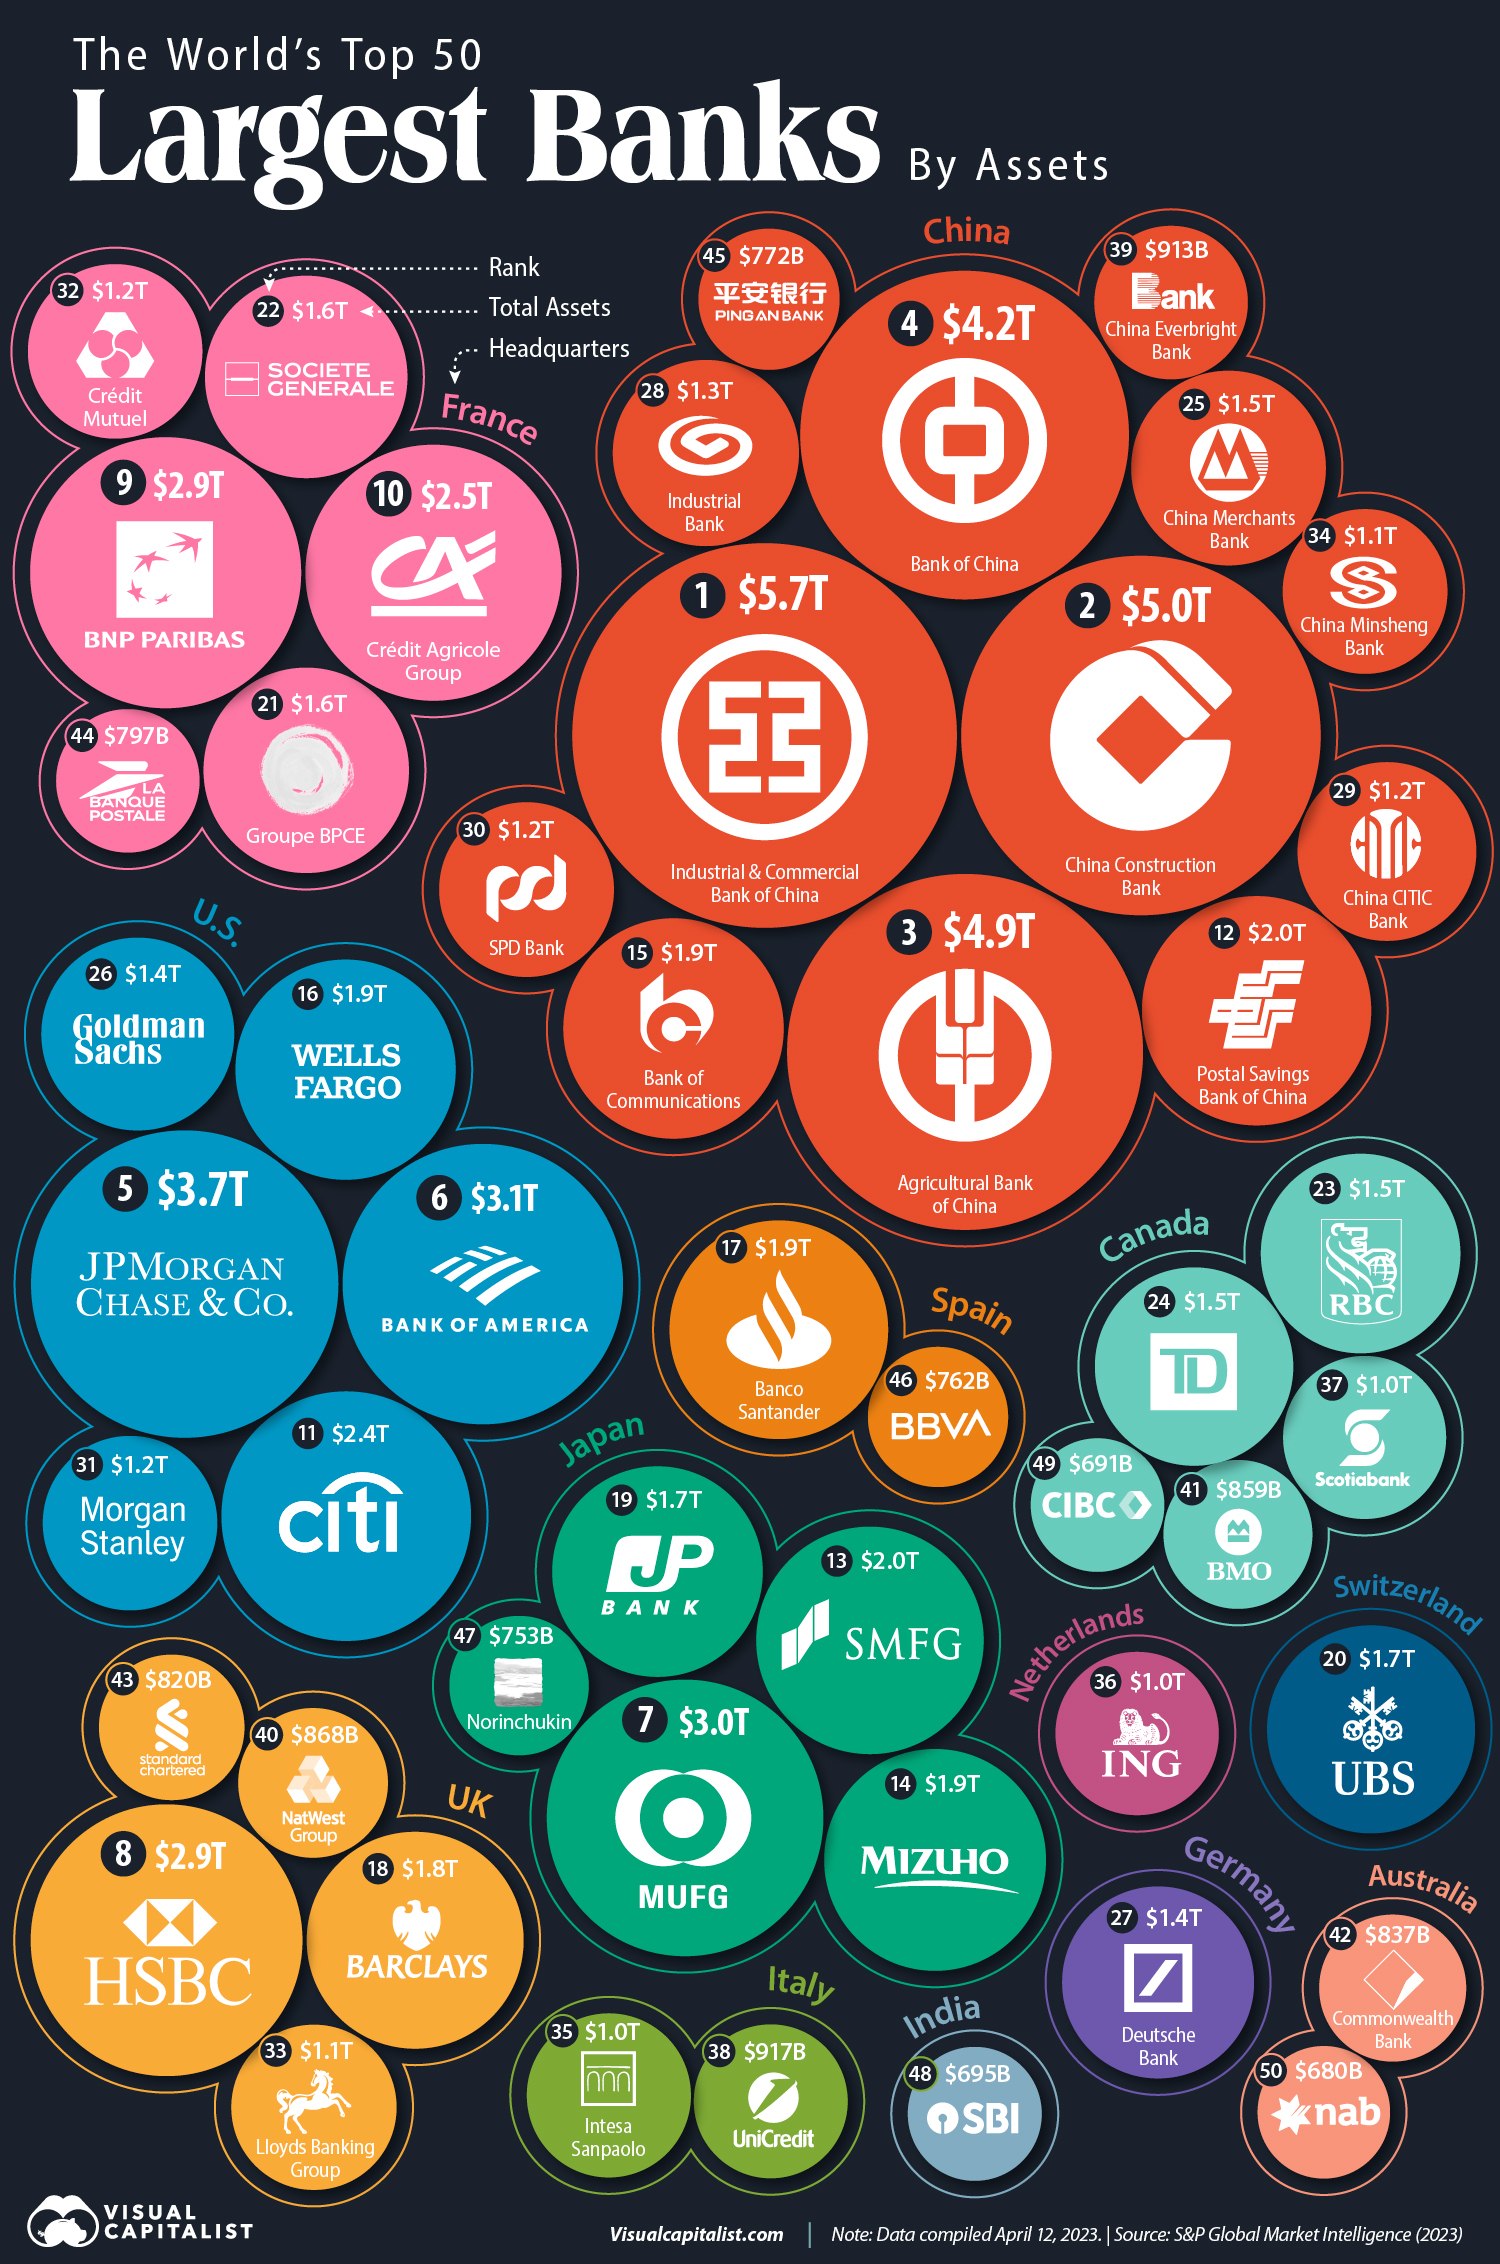
In this graphic, we list the top 50 banks in the world by consolidated assets, based on a 2023 report from S&P Global Market Intelligence. The data represents each bank’s total assets for the most recent period available.
Chinese Banks Keep on Growing
According to S&P, the four largest Chinese banks grew their assets by 4.1% in 2022, reaching a combined total of $19.8 trillion.
In fact, Chinese banks already account for over a third of the assets held by the largest banks on the planet. Four of the 15 biggest companies in China are banks.
| Rank | Bank | Headquarters | Total Assets |
|---|---|---|---|
| 1 | Industrial and Commercial Bank of China | 🇨🇳 China | $5.7T |
| 2 | China Construction Bank Corp | 🇨🇳 China | $5.0T |
| 3 | Agricultural Bank of China | 🇨🇳 China | $4.9T |
| 4 | Bank of China | 🇨🇳 China | $4.2T |
| 5 | JPMorgan Chase & Co. | 🇺🇸 US | $3.7T |
| 6 | Bank of America | 🇺🇸 US | $3.1T |
| 7 | Mitsubishi UFJ Financial Group | 🇯🇵 Japan | $3.0T |
| 8 | HSBC Holdings | 🇬🇧 UK | $2.9T |
| 9 | BNP Paribas | 🇫🇷 France | $2.9T |
| 10 | Crédit Agricole Group | 🇫🇷 France | $2.5T |
| 11 | Citigroup | 🇺🇸 US | $2.4T |
| 12 | Postal Savings Bank of China | 🇨🇳 China | $2.0T |
| 13 | Sumitomo Mitsui Financial Group | 🇯🇵 Japan | $2.0T |
| 14 | Mizuho Financial Group | 🇯🇵 Japan | $1.9T |
| 15 | Bank of Communications | 🇨🇳 China | $1.9T |
| 16 | Wells Fargo & Co. | 🇺🇸 US | $1.9T |
| 17 | Banco Santander | 🇪🇸 Spain | $1.9T |
| 18 | Barclays PLC | 🇬🇧 UK | $1.8T |
| 19 | JAPAN POST BANK | 🇯🇵 Japan | $1.7T |
| 20 | UBS Group | 🇨🇭 Switzerland | $1.7T |
| 21 | Groupe BPCE | 🇫🇷 France | $1.6T |
| 22 | Société Générale | 🇫🇷 France | $1.6T |
| 23 | Royal Bank of Canada | 🇨🇦 Canada | $1.5T |
| 24 | The Toronto-Dominion Bank | 🇨🇦 Canada | $1.5T |
| 25 | China Merchants Bank | 🇨🇳 China | $1.5T |
| 26 | Goldman Sachs Group | 🇺🇸 US | $1.4T |
| 27 | Deutsche Bank | 🇩🇪 Germany | $1.4T |
| 28 | Industrial Bank | 🇨🇳 China | $1.3T |
| 29 | China CITIC Bank International | 🇨🇳 China | $1.2T |
| 30 | Shanghai Pudong Development Bank | 🇨🇳 China | $1.2T |
| 31 | Morgan Stanley | 🇺🇸 US | $1.2T |
| 32 | Crédit Mutuel | 🇫🇷 France | $1.2T |
| 33 | Lloyds Banking Group | 🇬🇧 UK | $1.1T |
| 34 | China Minsheng Banking | 🇨🇳 China | $1.1T |
| 35 | Intesa Sanpaolo | 🇮🇹 Italy | $1.0T |
| 36 | ING Groep | 🇳🇱 Netherlands | $1.0T |
| 37 | The Bank of Nova Scotia | 🇨🇦 Canada | $1.0T |
| 38 | UniCredit | 🇮🇹 Italy | $917B |
| 39 | China Everbright Bank | 🇨🇳 China | $913B |
| 40 | NatWest Group | 🇬🇧 UK | $868B |
| 41 | Bank of Montreal | 🇨🇦 Canada | $859B |
| 42 | Commonwealth Bank of Australia | 🇦🇺 Australia | $837B |
| 43 | Standard Chartered | 🇬🇧 UK | $820B |
| 44 | La Banque Postale | 🇫🇷 France | $797B |
| 45 | Ping An Bank | 🇨🇳 China | $772B |
| 46 | Banco Bilbao Vizcaya Argentaria | 🇪🇸 Spain | $762B |
| 47 | The Norinchukin Bank | 🇯🇵 Japan | $753B |
| 48 | State Bank of India | 🇮🇳 India | $695B |
| 49 | Canadian Imperial Bank of Commerce | 🇨🇦 Canada | $691B |
| 50 | National Australia Bank | 🇦🇺 Australia | $680B |
The Chinese financial market is followed by the American market on our list, with six U.S. banks combining for $13.7 trillion in assets.
The top 10 on the list include four Chinese banks, two American institutions, two French, one Japanese, and one British.
The biggest climber on our rank was Swiss UBS Group AG. The bank surged to 20th place from 34th in 2021. Its $1.6 trillion asset size has been adjusted to incorporate troubled Credit Suisse Group AG, which UBS agreed to take over in an emergency deal orchestrated by the Swiss authorities in March 2023.
Assets held by the 100 largest banks totaled $111.97 trillion in 2022, down 1.5% from $113.67 trillion a year earlier. Some of the reasons include high inflation, interest rate hikes, and the Russia-Ukraine war, which dampened global economic growth and investor sentiment.


Wealth
Visualizing the Tax Burden of Every U.S. State
Tax burden measures the percent of an individual’s income that is paid towards taxes. See where it’s the highest by state in this graphic.


Visualizing the Tax Burden of Every U.S. State
This was originally posted on our Voronoi app. Download the app for free on iOS or Android and discover incredible data-driven charts from a variety of trusted sources.
This map graphic visualizes the total tax burden in each U.S. state as of March 2024, based on figures compiled by WalletHub.
It’s important to understand that under this methodology, the tax burden measures the percent of an average person’s income that is paid towards state and local taxes. It considers property taxes, income taxes, and sales & excise tax.
Data and Methodology
The figures we used to create this graphic are listed in the table below.
| State | Total Tax Burden |
|---|---|
| New York | 12.0% |
| Hawaii | 11.8% |
| Vermont | 11.1% |
| Maine | 10.7% |
| California | 10.4% |
| Connecticut | 10.1% |
| Minnesota | 10.0% |
| Illinois | 9.7% |
| New Jersey | 9.5% |
| Rhode Island | 9.4% |
| Utah | 9.4% |
| Kansas | 9.3% |
| Maryland | 9.3% |
| Iowa | 9.2% |
| Nebraska | 9.2% |
| Ohio | 8.9% |
| Indiana | 8.9% |
| Arkansas | 8.8% |
| Mississippi | 8.8% |
| Massachusetts | 8.6% |
| Virginia | 8.5% |
| West Virginia | 8.5% |
| Oregon | 8.4% |
| Colorado | 8.4% |
| Pennsylvania | 8.4% |
| Wisconsin | 8.3% |
| Louisiana | 8.3% |
| Kentucky | 8.3% |
| Washington | 8.0% |
| New Mexico | 8.0% |
| Michigan | 8.0% |
| North Carolina | 7.9% |
| Idaho | 7.9% |
| Arizona | 7.8% |
| Missouri | 7.8% |
| Georgia | 7.7% |
| Texas | 7.6% |
| Alabama | 7.5% |
| Montana | 7.5% |
| South Carolina | 7.5% |
| Nevada | 7.4% |
| Oklahoma | 7.0% |
| North Dakota | 6.8% |
| South Dakota | 6.4% |
| Delaware | 6.4% |
| Tennessee | 6.1% |
| Florida | 6.1% |
| Wyoming | 5.7% |
| New Hampshire | 5.6% |
| Alaska | 4.9% |
From this data we can see that New York has the highest total tax burden. Residents in this state will pay, on average, 12% of their income to state and local governments.
Breaking this down into its three components, the average New Yorker pays 4.6% of their income on income taxes, 4.4% on property taxes, and 3% in sales & excise taxes.
At the other end of the spectrum, Alaska has the lowest tax burden of any state, equaling 4.9% of income. This is partly due to the fact that Alaskans do not pay state income tax.
Hate Paying Taxes?
In addition to Alaska, there are several other U.S. states that don’t charge income taxes. These are: Florida, Nevada, South Dakota, Tennessee, Texas, Washington, and Wyoming.
It’s also worth noting that New Hampshire does not have a regular income tax, but does charge a flat 4% on interest and dividend income according to the Tax Foundation.
Learn More About Taxation From Visual Capitalist
If you enjoyed this post, be sure to check out this graphic which ranks the countries with the lowest corporate tax rates, from 1980 to today.

-

 Markets6 days ago
Mapped: Europe’s GDP Per Capita, by Country
-

 Energy2 weeks ago
Mapped: The Age of Energy Projects in Interconnection Queues, by State
-

 Mining2 weeks ago
Visualizing Global Gold Production in 2023
-

 Markets2 weeks ago
Visualized: Interest Rate Forecasts for Advanced Economies
-

 Economy2 weeks ago
The Most Valuable Companies in Major EU Economies
-

 Markets1 week ago
The World’s Fastest Growing Emerging Markets (2024-2029 Forecast)
-

 Markets1 week ago
Visualizing Global Inflation Forecasts (2024-2026)
-

 United States1 week ago
Charted: What Southeast Asia Thinks About China & the U.S.