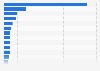
In 2023, around 19.58 million people were working for state and local governments in the United States. This is much higher than the number of federal government (civilian) employees, which stood at about 2.87 million people in that year.
Advertisement
Advertisement
Total number of government employees in the United States from 1982 to 2023
Characteristic
Federal (civilian)
State and local
1982
2.89
12.99
1983
2.91
13.16
1984
2.92
13.49
1985
2.97
13.67
1986
3.05
13.91
1987
3.07
14.12
1988
3.11
14.48
1989
3.15
14.77
1990
3.19
15.26
1991
3.09
15.45
1992
3.11
15.7
1993
3.07
15.82
1994
3.04
16.47
012345678910111213141516171819202122232425
Add this content to your personal favorites. These can be accessed from the favorites menu in the main navigation.
You have no right to use this feature.
Make sure to contact us if you are interested in scientific citation.
You can upgrade your account to enable this functionality for all statistics.
This feature is not available with your current account.Request access
*Figures for state and local are as of March each year from 1997 onwards, and October for prior years. No survey was conducted in 1996 due to this change.
Values have been rounded.
Cumulative data for state and local government can be accessed here.
Federal Government Employees taken from the bureau of Labor Statistics' Current Employment Statistics, and reflect an annual average which is available here. Select "One Screen" for "Employment, Hours, and Earnings - National", then: "All Employees, Thousands" for box 1, "Government" for box 2, and "Federal" for 3. Select 'not seasonally adjusted data' for March each year are used to align figures with local and state government data.
Statista has been my savior on several occasions.
The site is easy to maneuver and the data is in a format that can
go right into a report or presentation.
Learn more about how Statista can support your business.
US Census Bureau, & Bureau of Labor Statistics. (July 3, 2024). Total number of government employees in the United States from 1982 to 2023 [Graph]. In Statista. Retrieved July 30, 2025, from https://www.statista.com/statistics/204535/number-of-governmental-employees-in-the-us/
US Census Bureau, und Bureau of Labor Statistics. "Total number of government employees in the United States from 1982 to 2023." Chart. July 3, 2024. Statista. Accessed July 30, 2025. https://www.statista.com/statistics/204535/number-of-governmental-employees-in-the-us/
US Census Bureau, Bureau of Labor Statistics. (2024). Total number of government employees in the United States from 1982 to 2023. Statista. Statista Inc.. Accessed: July 30, 2025. https://www.statista.com/statistics/204535/number-of-governmental-employees-in-the-us/
US Census Bureau, and Bureau of Labor Statistics. "Total Number of Government Employees in The United States from 1982 to 2023." Statista, Statista Inc., 3 Jul 2024, https://www.statista.com/statistics/204535/number-of-governmental-employees-in-the-us/
US Census Bureau & Bureau of Labor Statistics, Total number of government employees in the United States from 1982 to 2023 Statista, https://www.statista.com/statistics/204535/number-of-governmental-employees-in-the-us/ (last visited July 30, 2025)
Total number of government employees in the United States from 1982 to 2023 [Graph], US Census Bureau, & Bureau of Labor Statistics, July 3, 2024. [Online]. Available: https://www.statista.com/statistics/204535/number-of-governmental-employees-in-the-us/
Advertisement
Profit from additional features with an Employee Account
Please create an employee account to be able to mark statistics as favorites.
Then you can access your favorite statistics via the star in the header.
Profit from the additional features of your individual account
Currently, you are using a shared account. To use individual functions (e.g., mark statistics as favourites, set
statistic alerts) please log in with your personal account.
If you are an admin, please authenticate by logging in again.