Misc
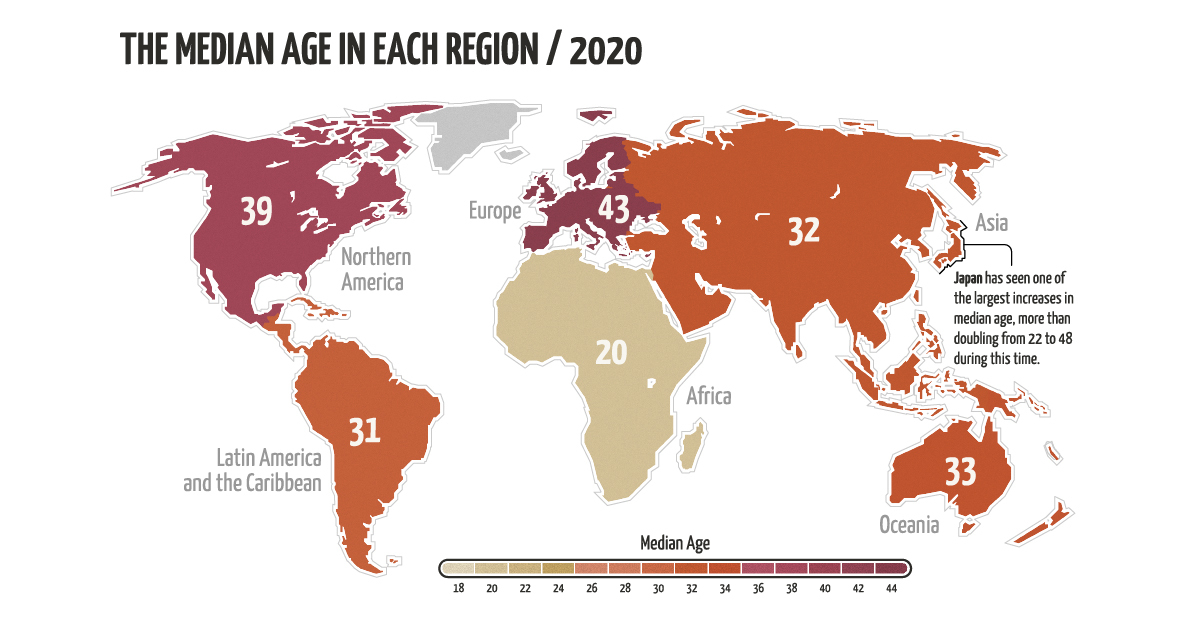
Mapped: Each Region’s Median Age Since 1950


Mapped: Each Region’s Median Age Since 1950
Over the last 70 years, the global population has gotten older. Since 1950, the worldwide median age has gone from 25 years to 33 years.
Yet, despite an overall increase globally, not all regions have aged at the same rate. For instance, Europe’s median age has grown by 14 years, while Africa’s has only increased by 1 year.
Today’s animated map uses data from the UN Population Index to highlight the changes in median age over the last 70 years, and to visualize the differences between each region. We also explain why some regions skew older than others.
Factors that Affect a Region’s Median Age
Before diving into the numbers, it’s important to understand the key factors that influence a region’s median age:
- Fertility Rate
The average number of children that women give birth to in their reproductive years. The higher the fertility rate, the younger a population skews. Since 1950, the global fertility rate has dropped by 50%. - Mortality Rate
The number of deaths in a particular region, usually associated with a certain demographic or period in time. For example, global child mortality (children who have died under five years of age) has been on the decline, which has contributed to an increase in the average life expectancy across the globe. - Migration
International migration may lower a region’s population since migrants are usually younger or working age. In 2019, there were 272 million migrants globally.
The Change in Median Age
As mentioned, not all regions are created equal. Here’s how much the median age has changed in each region since 1950:
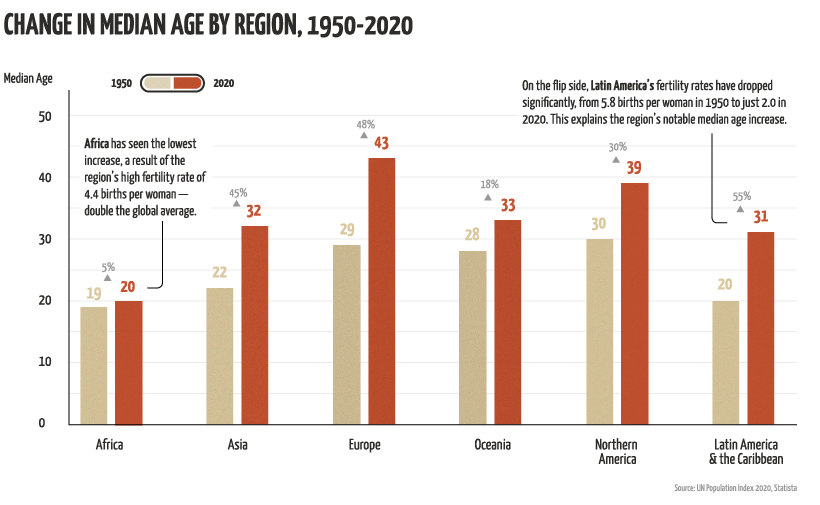
The Highs
Regions that have seen the most growth and generally skew older are Latin America, followed by Europe and Asia.
Interestingly, Asia’s notable increase is largely influenced by Japan, which has the oldest population on the planet. The country has seen a significant increase in median age since 1950—it’s gone from 22 to 48 years in 2020. This can be explained by its considerably low fertility rate, which is 1.4 births per woman—that’s less than half the global average.
But why is Japan’s fertility rate so low? There are more women in the workforce than ever before, and they are too busy to take on the burden of running a household. Yet, while women are more prosperous than ever, the workforce in general has taken a hit.
Japan’s recession in the early 1990s led to an increase in temporary jobs, which has had lasting effects on the region’s workforce—in 2019, about 1 in 5 men were working contract jobs with little stability or job growth.
The Lows
In contrast to Asia’s growth, Africa has seen the lowest increase in median age. The region’s population skews young, with over 60% of its population under the age of 25.
Africa’s young population can be explained by its high birth rate of 4.4 births per woman. It also has a relatively low life expectancy, at 65 years for women and 61 years for men. To put things into perspective, the average life expectancy across the globe is 75 years for women and 70 years for men.
Another trend worth noting is Oceania’s relatively small growth. It’s interesting because the region’s fertility rate is almost on par with the global average, at 2.4 births per woman, and the average life expectancy doesn’t differ much from the norm either.
The most likely reason for Oceania’s stagnant growth in median age is its high proportion of migrants. In 2019, the country had 8.9 million international migrants, which is 21% of its overall population. In contrast, migrants only make up 10% of North America’s population.
Unique Challenges for Every Region
Age composition has significant impacts on a region’s labor force, health services, and economic productivity.
Regions with a relatively high median age face several challenges such as shrinking workforce, higher taxes, and increasing healthcare costs. On the other end of the spectrum, regions with a younger population face increased demand for educational services and a lack of employment opportunities.
As our population worldwide continues to grow and age, it’s important to bring attention to issues that impact our global community. World Population Day on July 11, 2020, was established by the UN to try and solve worldwide population issues.
“The 2030 Agenda for Sustainable Development is the world’s blueprint for a better future for all on a healthy planet. On World Population Day, we recognize that this mission is closely interrelated with demographic trends including population growth, aging, migration, and urbanization.”
– UN Secretary-General António Guterres


Maps
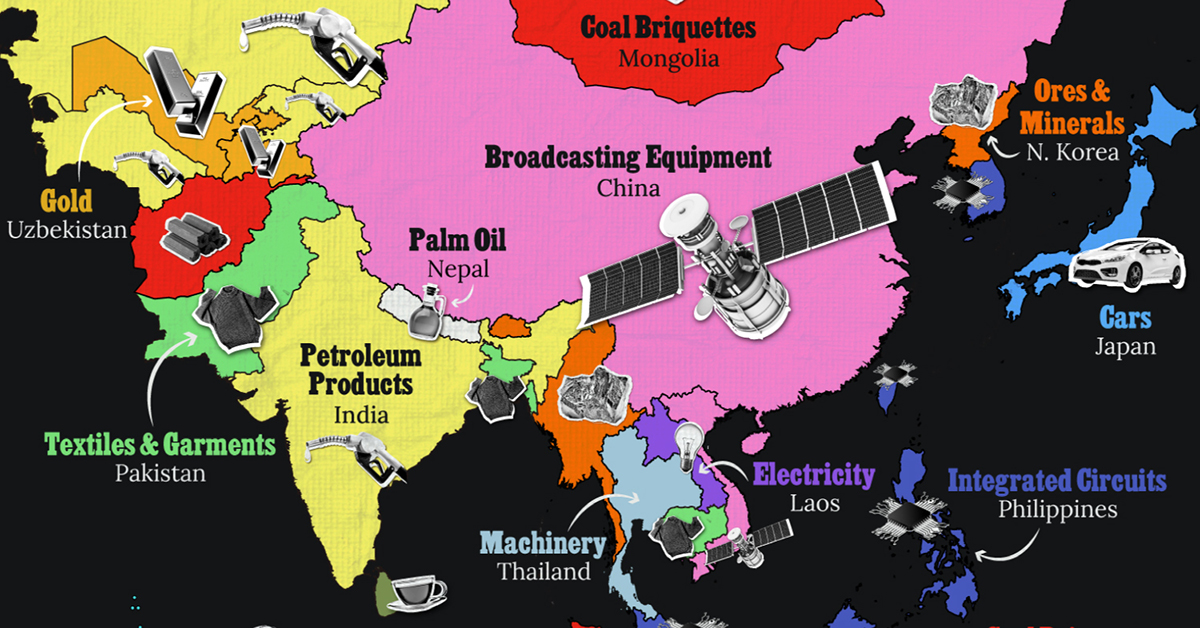
Mapped: The Top Exports in Asian Countries
Asia’s exports span a wide range, from petroleum to technology components and textile products.
The Top Exports in Asian Countries
This was originally posted on our Voronoi app. Download the app for free on iOS or Android and discover incredible data-driven charts from a variety of trusted sources.
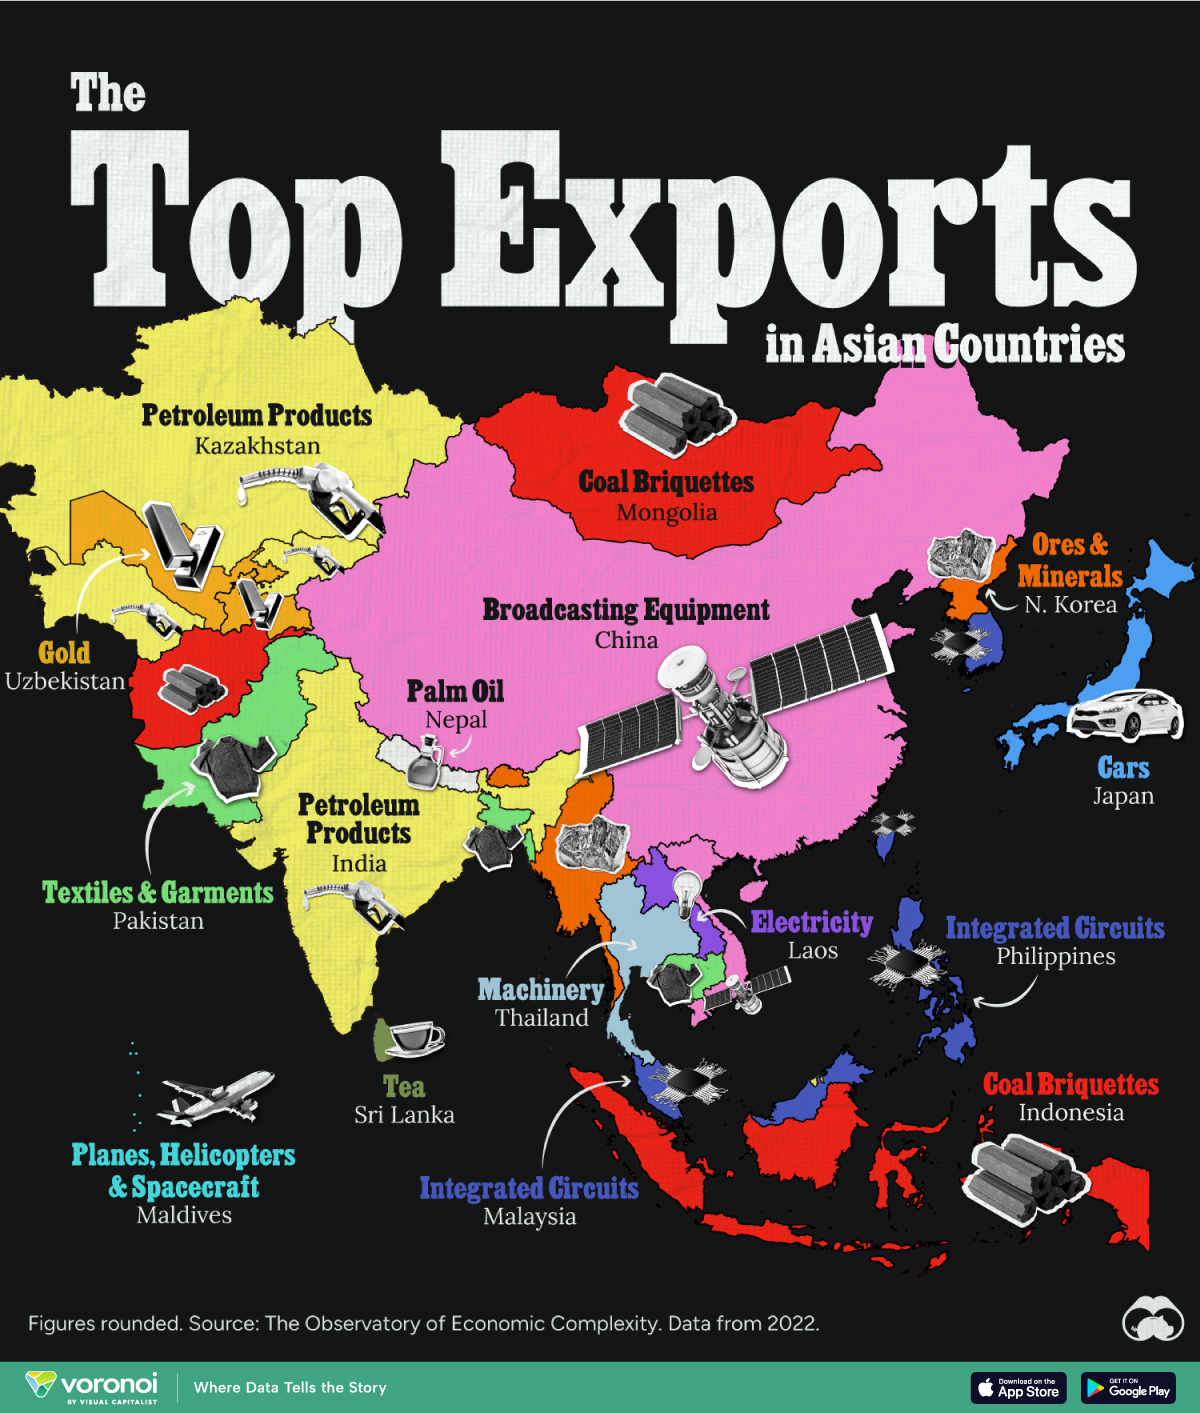
Asia’s exports span a wide range, from petroleum and minerals to technology components and textile products.
In this map, we display the top exports (as of 2022) of Asian countries, excluding Middle Eastern nations. Data was sourced from The Observatory of Economic Complexity.
Editor’s Note: For our most recent Middle East themed version of this map, go here.
Diverse Economies Across the Continent
Like in many other countries around the world, petroleum is a significant component of the Asian continental economy, with petroleum products as India’s top exporting category, amounting to approximately $86 billion per year in trade.
Another top product coming from Asia is integrated circuits. These are used in a multitude of applications spanning computing, communications, consumer electronics, automotive, industrial automation, medical devices, aerospace and defense.
| Country | Top Export (2022) | Top Export Value (USD Billions) |
|---|---|---|
| 🇨🇳 China | Broadcasting Equipment | $272.0 |
| 🇹🇼 Taiwan | Integrated Circuits | $223.0 |
| 🇰🇷 South Korea | Integrated Circuits | $121.0 |
| 🇯🇵 Japan | Cars | $89.0 |
| 🇮🇳 India | Petroleum Products | $86.2 |
| 🇸🇬 Singapore | Integrated Circuits | $81.9 |
| 🇲🇾 Malaysia | Integrated Circuits | $78.9 |
| 🇻🇳 Vietnam | Broadcasting Equipment | $58.5 |
| 🇮🇩 Indonesia | Coal Briquettes | $50.8 |
| 🇰🇿 Kazakhstan | Petroleum Products | $47.6 |
| 🇵🇭 Philippines | Integrated Circuits | $32.4 |
| 🇦🇿 Azerbaijan | Petroleum Products | $19.4 |
| 🇹🇭 Thailand | Machinery | $19.3 |
| 🇹🇲 Turkmenistan | Petroleum Products | $9.2 |
| 🇧🇩 Bangladesh | Textiles and Garments | $9.1 |
| 🇲🇳 Mongolia | Coal Briquettes | $6.5 |
| 🇺🇿 Uzbekistan | Gold | $5.2 |
| 🇧🇳 Brunei | Petroleum Products | $4.9 |
| 🇵🇰 Pakistan | Textiles and Garments | $4.9 |
| 🇲🇲 Myanmar (Burma) | Ore & Minerals | $4.1 |
| 🇰🇭 Cambodia | Textiles and Garments | $3.1 |
| 🇱🇦 Laos | Electricity | $2.4 |
| 🇱🇰 Sri Lanka | Tea | $1.3 |
| 🇬🇪 Georgia | Ore & Minerals | $1.0 |
| 🇦🇲 Armenia | Ore & Minerals | $0.7 |
| 🇹🇯 Tajikistan | Gold | $0.6 |
| 🇦🇫 Afghanistan | Coal Briquettes | $0.4 |
| 🇲🇻 Maldives | Planes, Helicopters, Spacecraft | $0.4 |
| 🇧🇹 Bhutan | Ore & Minerals | $0.3 |
| 🇹🇱 Timor-Leste (East Timor) | Petroleum Products | $0.3 |
| 🇳🇵 Nepal | Palm Oil | $0.2 |
| 🇰🇬 Kyrgyzstan | Petroleum Products | $0.1 |
| 🇰🇵 North Korea | Ore & Minerals | $0.03 |
In addition, the region is also a big manufacturer of semiconductors, crucial for applications ranging from telecommunications and artificial intelligence to renewable energy and healthcare. Taiwan holds a 68% share of the advanced semiconductor market.
Pakistan, Bangladesh, and Cambodia are major producers of textile products such as t-shirts, sweaters, and household linens. Most of their products go to the United States and Europe, feeding popular outfit brands.
Asia stands out as a top producer of minerals and fuel, with Afghanistan, Indonesia, and Mongolia being top producers of coal briquettes used for heating, cooking, and industrial processes, while Armenia, Georgia, Bhutan, Myanmar (Burma), and North Korea rely on ore and mineral extraction as their top exporting sector.
The largest Asian economy, China, is known for the production of a variety of products, but its top exports come from broadcasting equipment, including TVs, cameras, and radios.

-

 Demographics7 days ago
Mapped: U.S. Immigrants by Region
-

 United States2 weeks ago
Charted: What Southeast Asia Thinks About China & the U.S.
-

 United States2 weeks ago
The Evolution of U.S. Beer Logos
-

 Healthcare2 weeks ago
What Causes Preventable Child Deaths?
-

 Energy2 weeks ago
Who’s Building the Most Solar Energy?
-

 Markets1 week ago
Mapped: The Most Valuable Company in Each Southeast Asian Country
-

 Technology1 week ago
Mapped: The Number of AI Startups By Country
-

 Healthcare1 week ago
Life Expectancy by Region (1950-2050F)