Economy
Animated Chart: G7 vs. BRICS by GDP (PPP)
Article/Editing:
Animated Chart: G7 vs. BRICS by GDP (PPP)
Fifty years ago, the government finance heads from the UK, West Germany, France, and the U.S. met informally in the White House’s ground-floor library to discuss the international monetary situation at the time. This is the origin story of the G7.
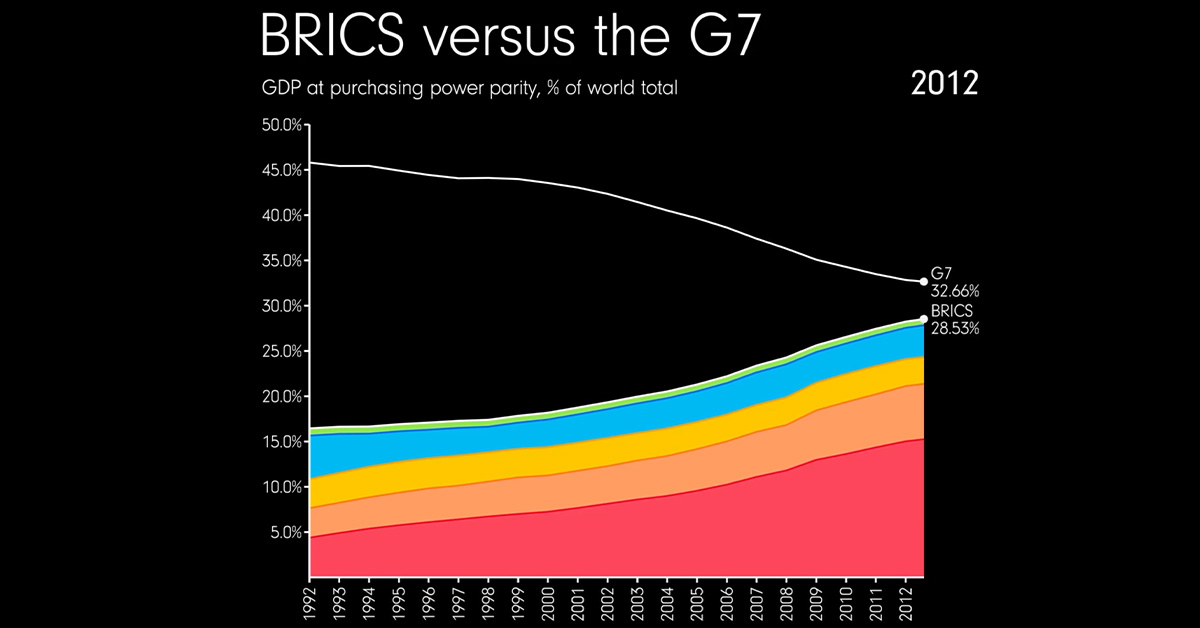
This initial group quickly expanded, adding Japan, Italy, and Canada, to solidify a bloc of the biggest non-communist economies at the time. As industrialized countries that were reaping the benefits of the post-war productivity boom, they were economic juggernauts, with G7 economic output historically contributing around 40% of global GDP.
However, the more recent emergence of another international group, BRICS (Brazil, Russia, India, China, and South Africa), has been carving out its own section of the global economic order.
This animation from James Eagle uses data from the International Monetary Fund (IMF) and charts the percentage contribution of the G7 and BRICS members to the world economy. Specifically it uses GDP adjusted for purchasing power parity (PPP) using international dollars.
Charting the Rise of BRICS vs. G7
The acronym “BRIC”, developed by Goldman Sachs economist Jim O’Neill in 2001, was used to identify four fast-growing economies in similar stages of development. It wasn’t until 2009 that their leaders met and formalized their relationship, later inviting South Africa to join in 2010.
While initially banded together for investment opportunities, in the last decade, BRICS has become an economic rival to G7. Several of their initiatives include building an alternate global bank, with dialogue underway for a payment system and new reserve currency.
Below is a quick look at both groups’ contribution to the world economy in PPP-adjusted terms.
| Global GDP Share | 1992 | 2002 | 2012 | 2022 |
|---|---|---|---|---|
| BRICS | 16.45% | 19.34% | 28.28% | 31.67% |
| G7 | 45.80% | 42.34% | 32.82% | 30.31% |
A major contributing factor to BRICS’ rise is Chinese and Indian economic growth.
After a period of rapid industrialization in the 1980s and 1990s, China’s exports got a significant boost after it joined the World Trade Organization in 2001. This helped China become the world’s second largest economy by 2010.
India’s economic rise has not been quite as swift as China’s, but by 2022, the country ranked third with a gross domestic product (PPP) of $12 trillion. Together the two countries make up nearly one-fourth of the PPP-adjusted $164 trillion world economy.
The consequence of using the PPP metric—which better reflects the strengths of local currencies and local prices—is that it has an outsized multiplier effect on the GDPs of developing countries, where the prices of domestic goods and services tend to be cheaper.
Below, we can see both the nominal and PPP-adjusted GDP of each G7 and BRICS country in 2023. Nominal GDP is measured in USD with market-rate currency conversion, while the adjusted GDP uses international dollars (using the U.S. as a base country for calculations) which better account for cost of living and inflation.
| Country/Group | Membership | Nominal GDP (2023) | PPP GDP (2023) |
|---|---|---|---|
| 🇺🇸 U.S. | G7 | $26.9T | $26.9T |
| 🇯🇵 Japan | G7 | $4.4T | $6.5T |
| 🇩🇪 Germany | G7 | $4.3T | $5.6T |
| 🇬🇧 UK | G7 | $3.2T | $3.9T |
| 🇫🇷 France | G7 | $2.9T | $3.9T |
| 🇮🇹 Italy | G7 | $2.2T | $3.2T |
| 🇨🇦 Canada | G7 | $2.1T | $2.4T |
| 🇨🇳 China | BRICS | $19.4T | $33.0T |
| 🇮🇳 India | BRICS | $3.7T | $13.0T |
| 🇧🇷 Brazil | BRICS | $2.1T | $4.0T |
| 🇷🇺 Russia | BRICS | $2.1T | $5.0T |
| 🇿🇦 South Africa | BRICS | $0.4T | $1.0T |
| G7 Total | $46.0T | $52.4T | |
| BRICS Total | $27.7T | $56.0T | |
By the IMF’s projections, BRICS countries will constitute more of the world economy in 2023 ($56 trillion) than the G7 ($52 trillion) using PPP-adjusted GDPs.
How Will BRICS and G7 Compare in the Future?
China and India are in a stage of economic development marked by increasing productivity, wages and consumption, which most countries in the G7 had previously enjoyed in the three decades after World War II.
By 2028, the IMF projects BRICS countries to make up one-third of the global economy (PPP):
| Country by GDP (PPP) | Membership | % World Economy (2028p) |
|---|---|---|
| 🇺🇸 U.S. | G7 | 14.5% |
| 🇯🇵 Japan | G7 | 3.3% |
| 🇩🇪 Germany | G7 | 2.9% |
| 🇬🇧 UK | G7 | 2.1% |
| 🇫🇷 France | G7 | 2.0% |
| 🇮🇹 Italy | G7 | 1.7% |
| 🇨🇦 Canada | G7 | 1.3% |
| 🇨🇳 China | BRICS | 19.7% |
| 🇮🇳 India | BRICS | 8.6% |
| 🇷🇺 Russia | BRICS | 2.6% |
| 🇧🇷 Brazil | BRICS | 2.2% |
| 🇿🇦 South Africa | BRICS | 0.5% |
| G7 Total | 27.8% | |
| BRICS Total | 33.7% | |
BRICS vs. the World?
The economic rise of BRICS carries geopolitical implications as well.
Alongside different political ideals, BRICS’ increasing power gives its member countries financial muscle to back them up. This was put into sharp perspective after the 2022 Russian invasion of Ukraine, when both China and India abstained from condemning the war at the United Nations and continued to buy Russian oil.
While this is likely concerning for G7 countries, the group of developed countries still wields unparalleled influence on the global stage. Nominally the G7 still commands a larger share of the global economy ($46 trillion) than BRICS ($27.7 trillion). And from the coordination of sanctions on Russia to sending military aid to Ukraine, the G7 still wields significant influence financially and politically.
In the next few decades, especially as China and India are earmarked to lead global growth while simultaneously grappling with their own internal demographic issues, the world order is only set to become more complex and nuanced as these international blocs vie for power.

This article was published as a part of Visual Capitalist's Creator Program, which features data-driven visuals from some of our favorite Creators around the world.


Misc
The Top 25 Nationalities of U.S. Immigrants
Mexico is the largest source of immigrants to the U.S., with almost 11 million immigrants.


The Top 25 Nationalities of U.S. Immigrants
This was originally posted on our Voronoi app. Download the app for free on iOS or Android and discover incredible data-driven charts from a variety of trusted sources.
The United States is home to more than 46 million immigrants, constituting approximately 14% of its total population.
This graphic displays the top 25 countries of origin for U.S. immigrants, based on 2022 estimates. The data is sourced from the Migration Policy Institute (MPI), which analyzed information from the U.S. Census Bureau’s 2022 American Community Survey.
In this context, “immigrants” refer to individuals residing in the United States who were not U.S. citizens at birth.
Mexico Emerges as a Leading Source of Immigration
Mexico stands out as the largest contributor to U.S. immigration due to its geographical proximity and historical ties.
Various economic factors, including wage disparities and employment opportunities, motivate many Mexicans to seek better prospects north of the border.
| Country | Region | # of Immigrants |
|---|---|---|
| 🇲🇽 Mexico | Latin America & Caribbean | 10,678,502 |
| 🇮🇳 India | Asia | 2,839,618 |
| 🇨🇳 China | Asia | 2,217,894 |
| 🇵🇭 Philippines | Asia | 1,982,333 |
| 🇸🇻 El Salvador | Latin America & Caribbean | 1,407,622 |
| 🇻🇳 Vietnam | Asia | 1,331,192 |
| 🇨🇺 Cuba | Latin America & Caribbean | 1,312,510 |
| 🇩🇴 Dominican Republic | Latin America & Caribbean | 1,279,900 |
| 🇬🇹 Guatemala | Latin America & Caribbean | 1,148,543 |
| 🇰🇷 Korea | Asia | 1,045,100 |
| 🇨🇴 Colombia | Latin America & Caribbean | 928,053 |
| 🇭🇳 Honduras | Latin America & Caribbean | 843,774 |
| 🇨🇦 Canada | Northern America | 821,322 |
| 🇯🇲 Jamaica | Latin America & Caribbean | 804,775 |
| 🇭🇹 Haiti | Latin America & Caribbean | 730,780 |
| 🇬🇧 United Kingdom | Europe | 676,652 |
| 🇻🇪 Venezuela | Latin America & Caribbean | 667,664 |
| 🇧🇷 Brazil | Latin America & Caribbean | 618,525 |
| 🇩🇪 Germany | Europe | 537,484 |
| 🇪🇨 Ecuador | Latin America & Caribbean | 518,287 |
| 🇵🇪 Peru | Latin America & Caribbean | 471,988 |
| 🇳🇬 Nigeria | Africa | 448,405 |
| 🇺🇦 Ukraine | Europe | 427,163 |
| 🇮🇷 Iran | Middle East | 407,283 |
| 🇵🇰 Pakistan | Asia | 399,086 |
| Rest of World | 11,637,634 | |
| Total | 46,182,089 |
Mexicans are followed in this ranking by Indians, Chinese, and Filipinos, though most immigrants on this list come from countries in the Latin American and Caribbean region.
On the other hand, only three European countries are among the top sources of U.S. immigrants: the UK, Germany, and Ukraine.
Immigration continues to be a significant factor contributing to the overall growth of the U.S. population. Overall population growth has decelerated over the past decade primarily due to declining birth rates.
Between 2021 and 2022, the increase in the immigrant population accounted for 65% of the total population growth in the U.S., representing 912,000 individuals out of nearly 1.4 million.
If you enjoyed this post, be sure to check out Visualized: Why Do People Immigrate to the U.S.? This visualization shows the different reasons cited by new arrivals to America in 2021.

-

 Personal Finance1 week ago
Visualizing the Tax Burden of Every U.S. State
-

 Misc7 days ago
Visualized: Aircraft Carriers by Country
-

 Culture7 days ago
How Popular Snack Brand Logos Have Changed
-

 Mining1 week ago
Visualizing Copper Production by Country in 2023
-

 Misc1 week ago
Charted: How Americans Feel About Federal Government Agencies
-

 Healthcare1 week ago
Which Countries Have the Highest Infant Mortality Rates?
-

 Demographics1 week ago
Mapped: U.S. Immigrants by Region
-

 Maps1 week ago
Mapped: Southeast Asia’s GDP Per Capita, by Country