Markets
The Fastest Growing and Declining Industries in the U.S. (2021-2031P)
Click to view this graphic in a higher-resolution.


U.S. Employment Trends by Industry (2021–2031)
The labor force is always shifting, responding to technological or societal changes.
For that reason, keeping an eye on the fastest growing industries can help workers and businesses stay on top of the crucial trends driving employment.
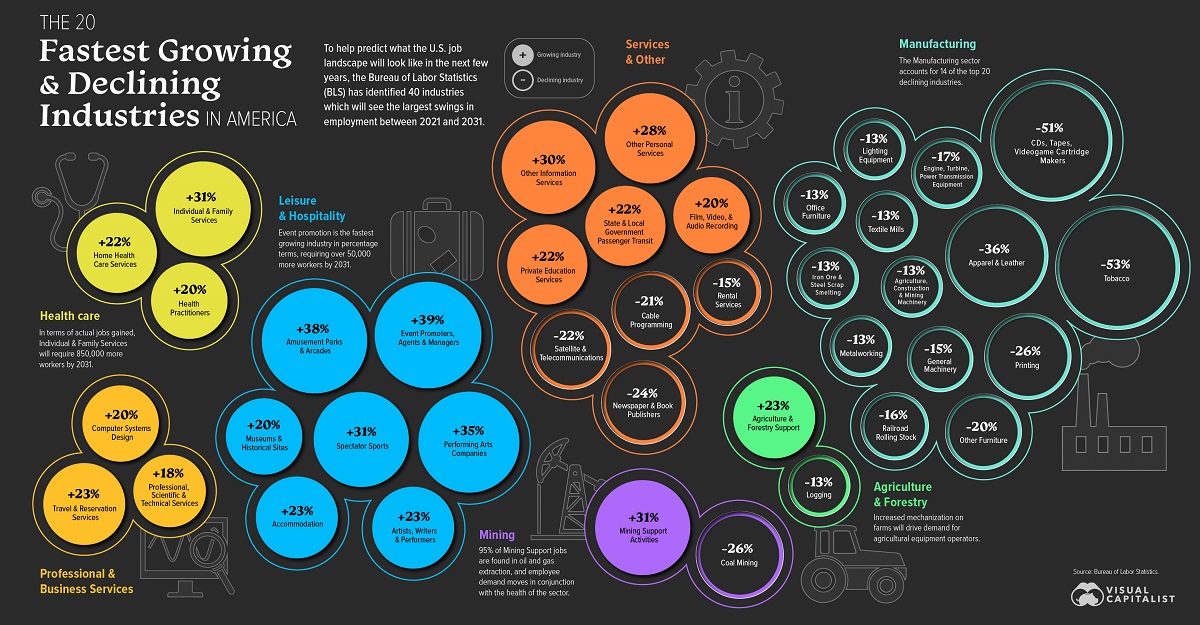
Today, we look through projections from the U.S. Bureau of Labor Statistics (BLS) on the fastest growing industries, as well as those that are the fastest declining, by percentage employment change between 2021 and 2031.
Ranked: Fastest Growing Industries By Employment Change
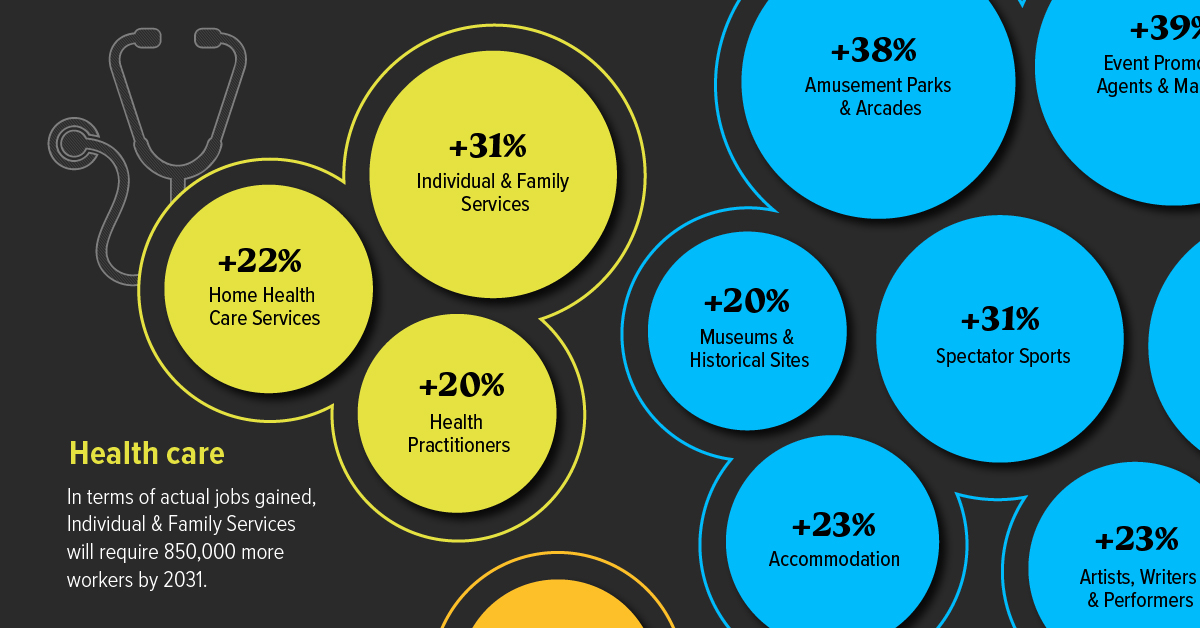
Event Promoters, Agents, and Managers top the list of fastest growing industries, with an impressive predicted growth of 39%, employing over 180,000 workers by 2031.
Amusement Parks and Arcades follows close behind, with an expected 38% increase—adding over 60,000 new employees—in the same time period. Ranked third, the Performing Arts industry will start the next decade with around a 100,000-strong workforce, up 35% from 2021.
Below is the full list of BLS’ projected fastest growing industries, ranked by percent change in employment, between 2021–2031.
| Rank | Industry | Sector | Change (2021-2031) | % Change (2021-2031) |
|---|---|---|---|---|
| 1 | Event Promoters, Agents & Managers | Leisure & Hospitality | 50,800 | +39% |
| 2 | Amusement Parks & Arcades | Leisure & Hospitality | 60,500 | +38% |
| 3 | Performing Arts Companies | Leisure & Hospitality | 28,400 | +35% |
| 4 | Individual & Family services | Health Care | 850,000 | +31% |
| 5 | Mining Support Activities | Mining | 69,700 | +31% |
| 6 | Spectator Sports | Leisure & Hospitality | 36,500 | +31% |
| 7 | Other Information Services | Services & Other | 112,900 | +30% |
| 8 | Other Personal Services | Services & Other | 87,200 | +28% |
| 9 | Travel & Reservation Services | Professional & Business Services | 32,300 | +23% |
| 10 | Agriculture & Forestry Support | Agriculture & Forestry | 26,200 | +23% |
| 11 | Artists, Writers & Performers | Leisure & Hospitality | 11,500 | +23% |
| 12 | Accommodation | Leisure & Hospitality | 333,700 | +23% |
| 13 | Private Education Services | Services & Other | 169,200 | +22% |
| 14 | Government Transit | Services & Other | 61,200 | +22% |
| 15 | Home Health Care Services | Health Care | 330,100 | +22% |
| 16 | Health Practitioners | Health Care | 205,500 | +20% |
| 17 | Film, Video, & Audio Recording | Services & Other | 75,300 | +20% |
| 18 | Museums & Historical Sites | Leisure & Hospitality | 27,600 | +20% |
| 19 | Computer Systems Design | Professional & Business Services | 455,200 | +20% |
| 20 | Professional, Scientific & Technical Services | Professional & Business Services | 144,100 | +18% |
Note: Services & Other sector includes Information, Education and State & Local Government industries.
All of the top three industries belong to the Leisure and Hospitality sector, which accounts for seven of the 20 fastest growing industries. This outsized performance reflects recovery more than pure growth, as the BLS notes that the Leisure and Hospitality sector was unduly affected by the COVID-19 pandemic, giving it a lower-than-usual baseline in 2021.
Ranked fourth by employment change percentage is Individual and Family Services, though it is actually expected to see the largest growth in total employment terms, adding 850,000 new workers by the end of the decade. It is one of three industries in the Health Care and Social Assistance sector with large projected growth, thanks to an increased need for care service due to an aging American population.
Not to be missed is Computer Systems Design, projected to grow by 20% in employment thanks to growing demand for computing infrastructure and IT security. Due the industry’s sheer size in employment force with 2.3 million workers in 2021, that’s close to half a million additional workers over the next decade.
Ranked: Fastest Declining Industries By Employment Change
Tobacco Manufacturing leads the group of industries expected to register employment declines by 2031, with a projected decrease of 53% in employment, bringing its already small workforce down to only 5,000 employees by the end of the decade. This stark decline is not necessarily driven by waning smoking habits, as cigarette sales in the U.S. went up during the pandemic. Instead, further automation of the industry may replace tobacco manufacturing employees.
Another industry facing a similar situation is CDs & Tapes Manufacturing, which is expected to witness a 51% reduction in employees by 2031.
Below is the full list of BLS’ projected fastest declining industries, ranked by percent change in employment, between 2021–2031.
| Rank | Industry | Sector | Change (2021-31) | % Change (2021-2031) |
|---|---|---|---|---|
| 1 | Tobacco Manufacturing | Manufacturing | -5,700 | -53% |
| 2 | CDs & Tapes Manufacturing | Manufacturing | -5,800 | -51% |
| 3 | Apparel & Leather Manufacturing | Manufacturing | -41,800 | -36% |
| 4 | Printing | Manufacturing | -96,800 | -26% |
| 5 | Coal Mining | Mining | -9,500 | -26% |
| 6 | Newspaper & Book Publishers | Services & Other | -60,000 | -24% |
| 7 | Satellite & Telecommunications | Services & Other | -19,300 | -22% |
| 8 | Cable Programming | Services & Other | -9,700 | -21% |
| 9 | Other Furniture Manufacturing | Manufacturing | -7,600 | -20% |
| 10 | Engine & Power Transmission Equipment Manufacturing | Manufacturing | -14,800 | -17% |
| 11 | Railroad Rolling Stock Manufacturing | Manufacturing | -3,100 | -16% |
| 12 | Rental Services | Services & Other | -22,200 | -15% |
| 13 | General Machinery Manufacturing | Manufacturing | -39,800 | -15% |
| 14 | Iron Ore & Steel Scrap Smelting | Manufacturing | -10,600 | -13% |
| 15 | Lighting Equipment Manufacturing | Manufacturing | -5,600 | -13% |
| 16 | Metalworking Manufacturing | Manufacturing | -21,100 | -13% |
| 17 | Logging | Agriculture & Forestry | -6,000 | -13% |
| 18 | Textile Mills | Manufacturing | -26,100 | -13% |
| 19 | Agriculture, Construction & Mining Machinery Manufacturing | Manufacturing | -25,500 | -13% |
| 20 | Office Furniture Manufacturing | Manufacturing | -12,600 | -13% |
Most of the industries facing large total employment contraction belong to the Manufacturing sector. The troubles of American manufacturing aren’t new, but the variety of industries presented suggests a mix of factors causing slumps across the sector.
Some industries like Printing, Cable Programming, and Newspaper and Book Publishers face shifting consumption habits.
Meanwhile, others like Textiles, Apparel, and Furniture Manufacturing are expected to suffer from further automation and shifted production abroad.
Factors Shaping Future Employment Trends in the U.S.
It’s important to note that these projections by the BLS were released in September 2022. That means they do not reflect the rapid rise of generative AI like ChatGPT and how they have begun to affect the economy.
A recent Goldman Sachs report, for example, stated that AI could replace 300 million jobs—almost the size of the U.S. population—around the world in the next 10 years.
That makes it an open and important question as to whether AI or powerful demographic trends, such as slower population growth and an aging workforce, will be the most impactful in terms of determining the future employment landscape.


Markets
Mapped: Europe’s GDP Per Capita, by Country
Which European economies are richest on a GDP per capita basis? This map shows the results for 44 countries across the continent.


Mapped: Europe’s GDP Per Capita, by Country (2024)
This was originally posted on our Voronoi app. Download the app for free on iOS or Android and discover incredible data-driven charts from a variety of trusted sources.
Europe is home to some of the largest and most sophisticated economies in the world. But how do countries in the region compare with each other on a per capita productivity basis?
In this map, we show Europe’s GDP per capita levels across 44 nations in current U.S. dollars. Data for this visualization and article is sourced from the International Monetary Fund (IMF) via their DataMapper tool, updated April 2024.
Europe’s Richest and Poorest Nations, By GDP Per Capita
Luxembourg, Ireland, and Switzerland, lead the list of Europe’s richest nations by GDP per capita, all above $100,000.
| Rank | Country | GDP Per Capita (2024) |
|---|---|---|
| 1 | 🇱🇺 Luxembourg | $131,380 |
| 2 | 🇮🇪 Ireland | $106,060 |
| 3 | 🇨🇭 Switzerland | $105,670 |
| 4 | 🇳🇴 Norway | $94,660 |
| 5 | 🇮🇸 Iceland | $84,590 |
| 6 | 🇩🇰 Denmark | $68,900 |
| 7 | 🇳🇱 Netherlands | $63,750 |
| 8 | 🇸🇲 San Marino | $59,410 |
| 9 | 🇦🇹 Austria | $59,230 |
| 10 | 🇸🇪 Sweden | $58,530 |
| 11 | 🇧🇪 Belgium | $55,540 |
| 12 | 🇫🇮 Finland | $55,130 |
| 13 | 🇩🇪 Germany | $54,290 |
| 14 | 🇬🇧 UK | $51,070 |
| 15 | 🇫🇷 France | $47,360 |
| 16 | 🇦🇩 Andorra | $44,900 |
| 17 | 🇲🇹 Malta | $41,740 |
| 18 | 🇮🇹 Italy | $39,580 |
| 19 | 🇨🇾 Cyprus | $37,150 |
| 20 | 🇪🇸 Spain | $34,050 |
| 21 | 🇸🇮 Slovenia | $34,030 |
| 22 | 🇪🇪 Estonia | $31,850 |
| 23 | 🇨🇿 Czech Republic | $29,800 |
| 24 | 🇵🇹 Portugal | $28,970 |
| 25 | 🇱🇹 Lithuania | $28,410 |
| 26 | 🇸🇰 Slovakia | $25,930 |
| 27 | 🇱🇻 Latvia | $24,190 |
| 28 | 🇬🇷 Greece | $23,970 |
| 29 | 🇭🇺 Hungary | $23,320 |
| 30 | 🇵🇱 Poland | $23,010 |
| 31 | 🇭🇷 Croatia | $22,970 |
| 32 | 🇷🇴 Romania | $19,530 |
| 33 | 🇧🇬 Bulgaria | $16,940 |
| 34 | 🇷🇺 Russia | $14,390 |
| 35 | 🇹🇷 Türkiye | $12,760 |
| 36 | 🇲🇪 Montenegro | $12,650 |
| 37 | 🇷🇸 Serbia | $12,380 |
| 38 | 🇦🇱 Albania | $8,920 |
| 39 | 🇧🇦 Bosnia & Herzegovina | $8,420 |
| 40 | 🇲🇰 North Macedonia | $7,690 |
| 41 | 🇧🇾 Belarus | $7,560 |
| 42 | 🇲🇩 Moldova | $7,490 |
| 43 | 🇽🇰 Kosovo | $6,390 |
| 44 | 🇺🇦 Ukraine | $5,660 |
| N/A | 🇪🇺 EU Average | $44,200 |
Note: Figures are rounded.
Three Nordic countries (Norway, Iceland, Denmark) also place highly, between $70,000-90,000. Other Nordic peers, Sweden and Finland rank just outside the top 10, between $55,000-60,000.
Meanwhile, Europe’s biggest economies in absolute terms, Germany, UK, and France, rank closer to the middle of the top 20, with GDP per capitas around $50,000.
Finally, at the end of the scale, Eastern Europe as a whole tends to have much lower per capita GDPs. In that group, Ukraine ranks last, at $5,660.
A Closer Look at Ukraine
For a broader comparison, Ukraine’s per capita GDP is similar to Iran ($5,310), El Salvador ($5,540), and Guatemala ($5,680).
According to experts, Ukraine’s economy has historically underperformed to expectations. After the fall of the Berlin Wall, the economy contracted for five straight years. Its transition to a Western, liberalized economic structure was overshadowed by widespread corruption, a limited taxpool, and few revenue sources.
Politically, its transformation from authoritarian regime to civil democracy has proved difficult, especially when it comes to institution building.
Finally, after the 2022 invasion of the country, Ukraine’s GDP contracted by 30% in a single year—the largest loss since independence. Large scale emigration—to the tune of six million refugees—is also playing a role.
Despite these challenges, the country’s economic growth has somewhat stabilized while fighting continues.

-

 Mining6 days ago
Where the World’s Aluminum is Smelted, by Country
-

 Markets2 weeks ago
Visualized: Interest Rate Forecasts for Advanced Economies
-

 Economy2 weeks ago
The Most Valuable Companies in Major EU Economies
-

 Markets2 weeks ago
The World’s Fastest Growing Emerging Markets (2024-2029 Forecast)
-

 Markets2 weeks ago
Visualizing Global Inflation Forecasts (2024-2026)
-

 Misc1 week ago
Charted: What Southeast Asia Thinks About China & the U.S.
-

 Misc1 week ago
The Evolution of U.S. Beer Logos
-

 Healthcare1 week ago
What Causes Preventable Child Deaths?