Energy
Global EV Production: BYD Surpasses Tesla
![]() Subscribe to the Elements free mailing list for more like this
Subscribe to the Elements free mailing list for more like this
Global EV Production: BYD Surpasses Tesla
This was originally posted on Elements. Sign up to the free mailing list to get beautiful visualizations on natural resource megatrends in your email every week.
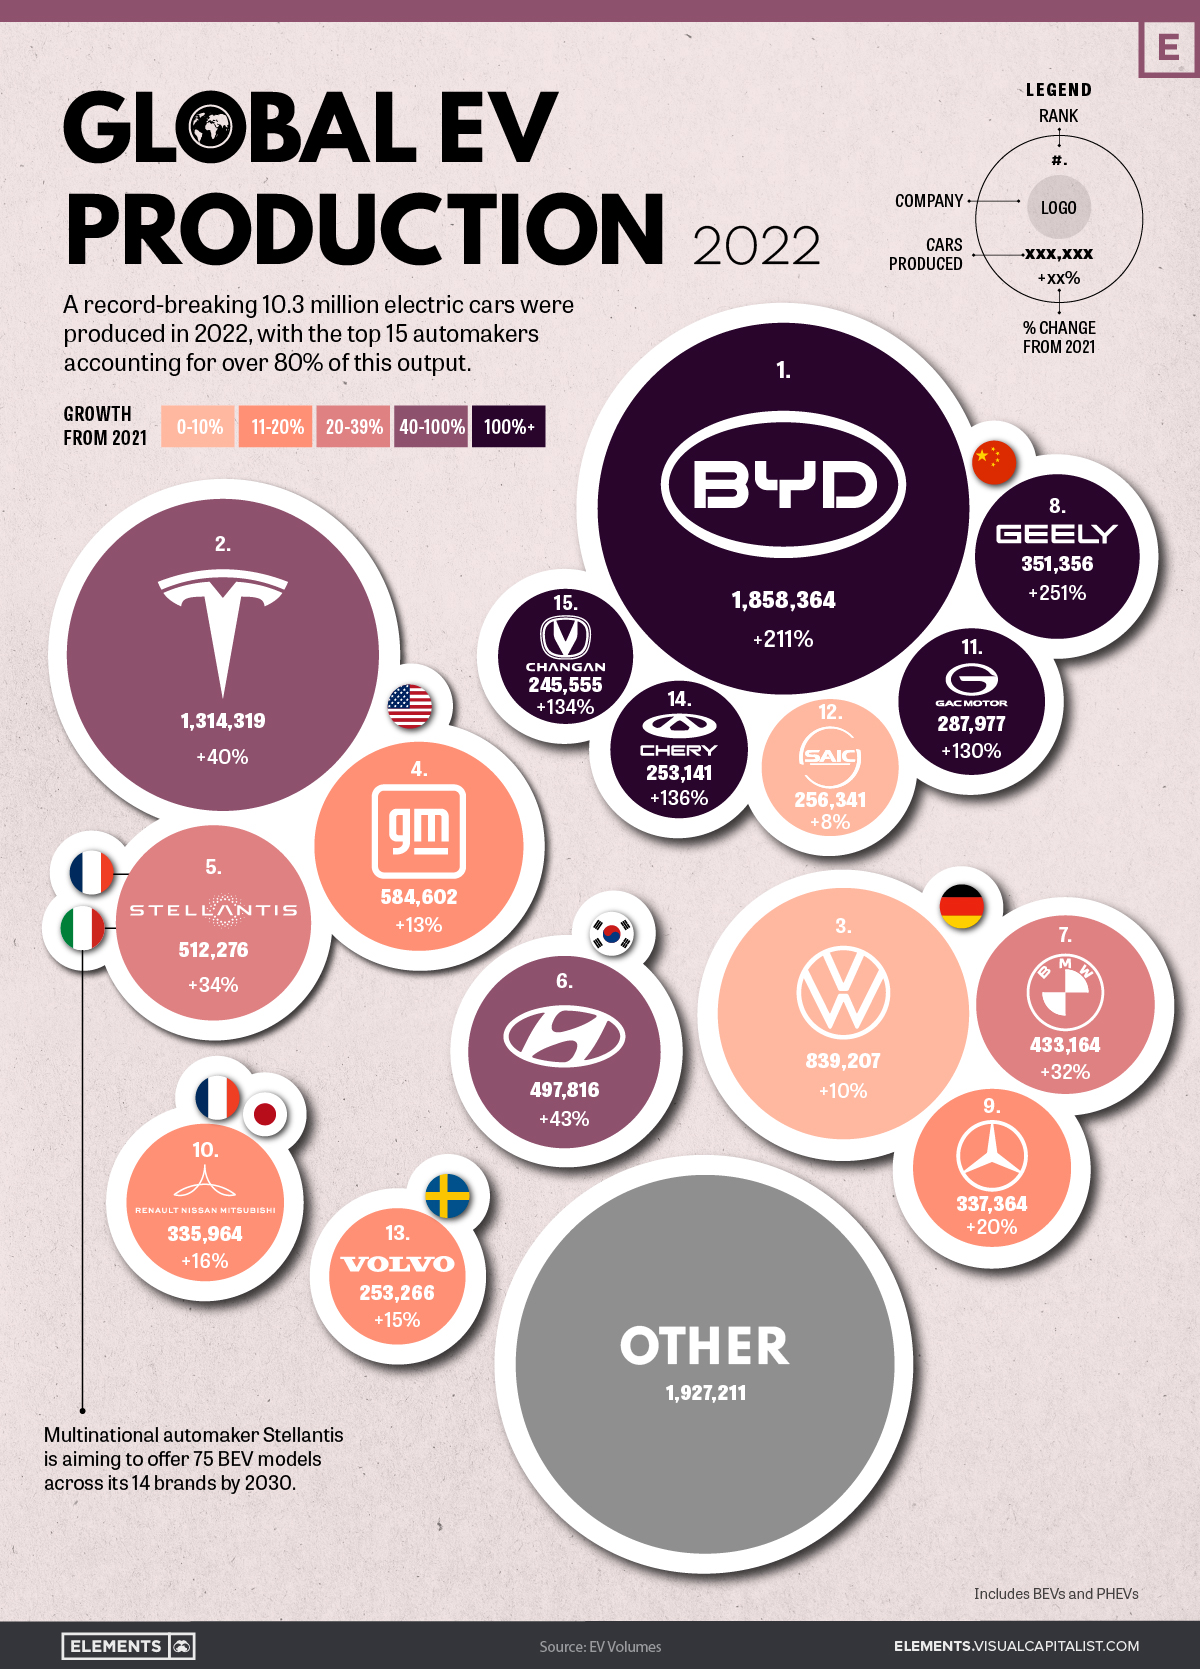
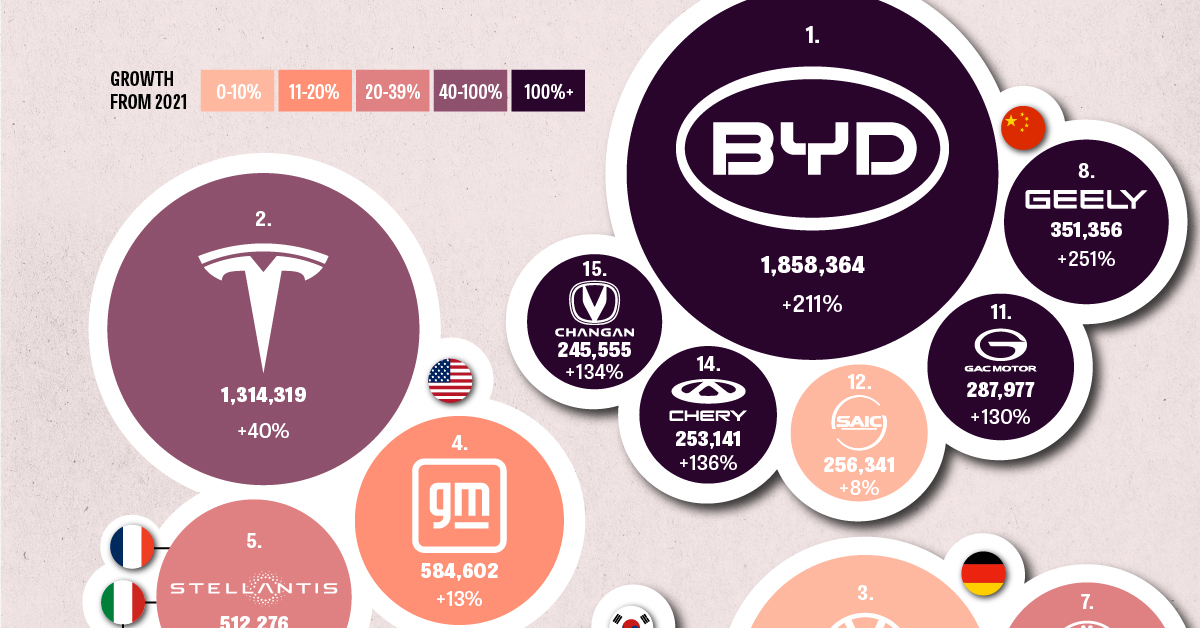
2022 was another historic year for EVs, with annual production surpassing 10 million cars for the first time ever. This represents a sizeable bump up from 2021’s figure of 6.7 million.
In this infographic, we’ve used data from EV Volumes to visualize the top 15 brands by output. The color of each brand’s bubble represents their growth from 2021, with the darker shades depicting a larger percentage increase.
Data Overview and Key Takeaways
The raw data we used to create this infographic is listed below. Volume figures for 2021 were included for convenience.
| Rank | Company | 2022 | 2021 | Growth from 2021 |
|---|---|---|---|---|
| 1 | 🇨🇳 BYD | 1,858,364 | 598,019 | 211% |
| 2 | 🇺🇸 Tesla | 1,314,319 | 936,247 | 40% |
| 3 | 🇩🇪 VW Group | 839,207 | 763,851 | 10% |
| 4 | 🇺🇸 GM (incl. Wuling Motors) | 584,602 | 516,631 | 13% |
| 5 | 🇺🇸 🇮🇹 🇫🇷 Stellantis | 512,276 | 381,843 | 34% |
| 6 | 🇰🇷 Hyundai Motors (incl. Kia) | 497,816 | 348,660 | 43% |
| 7 | 🇩🇪 BMW Group | 433,164 | 329,182 | 32% |
| 8 | 🇨🇳 Geely Auto Group | 351,356 | 99,980 | 251% |
| 9 | 🇩🇪 Mercedes-Benz Group | 337,364 | 281,929 | 20% |
| 10 | 🇫🇷 🇯🇵 Renault-Nissan-Mitsubishi Alliance | 335,964 | 289,473 | 16% |
| 11 | 🇨🇳 GAC Group | 287,977 | 125,384 | 130% |
| 12 | 🇨🇳 SAIC Motor Corp. | 256,341 | 237,043 | 8% |
| 13 | 🇸🇪 Volvo Cars | 253,266 | 220,576 | 15% |
| 14 | 🇨🇳 Chery Auto Co. | 253,141 | 107,482 | 136% |
| 15 | 🇨🇳 Changan Auto Co. | 245,555 | 105,072 | 134% |
| 16 | 🌎 Other (41 companies) | 1,927,211 | 1,326,262 | 45% |
Includes BEVs and PHEVs
BYD Auto
BYD Auto has leaped past Tesla to become the new EV king, boosting its output by a massive 211% in 2022. Given this trajectory, the company will likely become the world’s first automaker to produce over 2 million EVs in a single year.
BYD has a limited presence in non-domestic markets, but this could change rather quickly. The company is planning a major push into Europe, where it expects to build factories in order to avoid EU tariffs on Chinese car imports.
The company is also building a factory in Thailand, to produce right-hand drive models for markets like Australia, New Zealand, and the UK.
Tesla
Tesla increased its output by a respectable 40% in 2022, staying ahead of Western brands like Volkswagen (+10%) and GM (+13%), but falling behind its Chinese rivals such as Geely (+251%).
Whether these Chinese brands can maintain their triple digit growth figures is uncertain, but one thing is clear: Tesla is facing more competition than ever before.
The company is targeting annual production of 20 million cars by 2030, meaning it will need to keep yearly growth rates in the high double digits for the rest of the decade. To support this initiative, Tesla is planning a multi-billion dollar factory in Mexico capable of producing 1 million cars a year.
Hyundai
Hyundai Motor Company, which also owns Kia, posted a similar growth rate to Tesla. The South Korean automaker was a relatively early player in the EV space, revealing the first Hyundai Ioniq in 2016.
In late 2022, several countries including South Korea expressed their disapproval of the Biden administration’s Inflation Reduction Act, which withdrew tax credits on EVs not produced within the United States.
Hyundai is currently building a $5.5 billion EV factory in the state of Georgia, but this facility will not become operational until 2025. In the meantime, South Korea has revised its own EV subsidy program to favor domestic brands.


Who’s Building the Most Solar Energy?
This was originally posted on our Voronoi app. Download the app for free on iOS or Android and discover incredible data-driven charts from a variety of trusted sources.
In 2023, solar energy accounted for three-quarters of renewable capacity additions worldwide. Most of this growth occurred in Asia, the EU, and the U.S., continuing a trend observed over the past decade.
In this graphic, we illustrate the rise in installed solar photovoltaic (PV) capacity in China, the EU, and the U.S. between 2010 and 2022, measured in gigawatts (GW). Bruegel compiled the data..
Chinese Dominance
As of 2022, China’s total installed capacity stands at 393 GW, nearly double that of the EU’s 205 GW and surpassing the USA’s total of 113 GW by more than threefold in absolute terms.
| Installed solar capacity (GW) | China | EU27 | U.S. |
|---|---|---|---|
| 2022 | 393.0 | 205.5 | 113.0 |
| 2021 | 307.0 | 162.7 | 95.4 |
| 2020 | 254.0 | 136.9 | 76.4 |
| 2019 | 205.0 | 120.1 | 61.6 |
| 2018 | 175.3 | 104.0 | 52.0 |
| 2017 | 130.8 | 96.2 | 43.8 |
| 2016 | 77.8 | 91.5 | 35.4 |
| 2015 | 43.6 | 87.7 | 24.2 |
| 2014 | 28.4 | 83.6 | 18.1 |
| 2013 | 17.8 | 79.7 | 13.3 |
| 2012 | 6.7 | 71.1 | 8.6 |
| 2011 | 3.1 | 53.3 | 5.6 |
| 2010 | 1.0 | 30.6 | 3.4 |
Since 2017, China has shown a compound annual growth rate (CAGR) of approximately 25% in installed PV capacity, while the USA has seen a CAGR of 21%, and the EU of 16%.
Additionally, China dominates the production of solar power components, currently controlling around 80% of the world’s solar panel supply chain.
In 2022, China’s solar industry employed 2.76 million individuals, with manufacturing roles representing approximately 1.8 million and the remaining 918,000 jobs in construction, installation, and operations and maintenance.
The EU industry employed 648,000 individuals, while the U.S. reached 264,000 jobs.
According to the IEA, China accounts for almost 60% of new renewable capacity expected to become operational globally by 2028.
Despite the phasing out of national subsidies in 2020 and 2021, deployment of solar PV in China is accelerating. The country is expected to reach its national 2030 target for wind and solar PV installations in 2024, six years ahead of schedule.

-

 Brands5 days ago
The Evolution of U.S. Beer Logos
-

 Culture2 weeks ago
The World’s Top Media Franchises by All-Time Revenue
-

 voronoi2 weeks ago
Best Visualizations of April on the Voronoi App
-

 Wealth2 weeks ago
Charted: Which Country Has the Most Billionaires in 2024?
-

 Business1 week ago
The Top Private Equity Firms by Country
-

 Markets1 week ago
The Best U.S. Companies to Work for According to LinkedIn
-

 Economy1 week ago
Ranked: The Top 20 Countries in Debt to China
-

 Politics1 week ago
Charted: Trust in Government Institutions by G7 Countries