Markets
Ranked: The World’s Most Valuable Bank Brands (2019-2023)
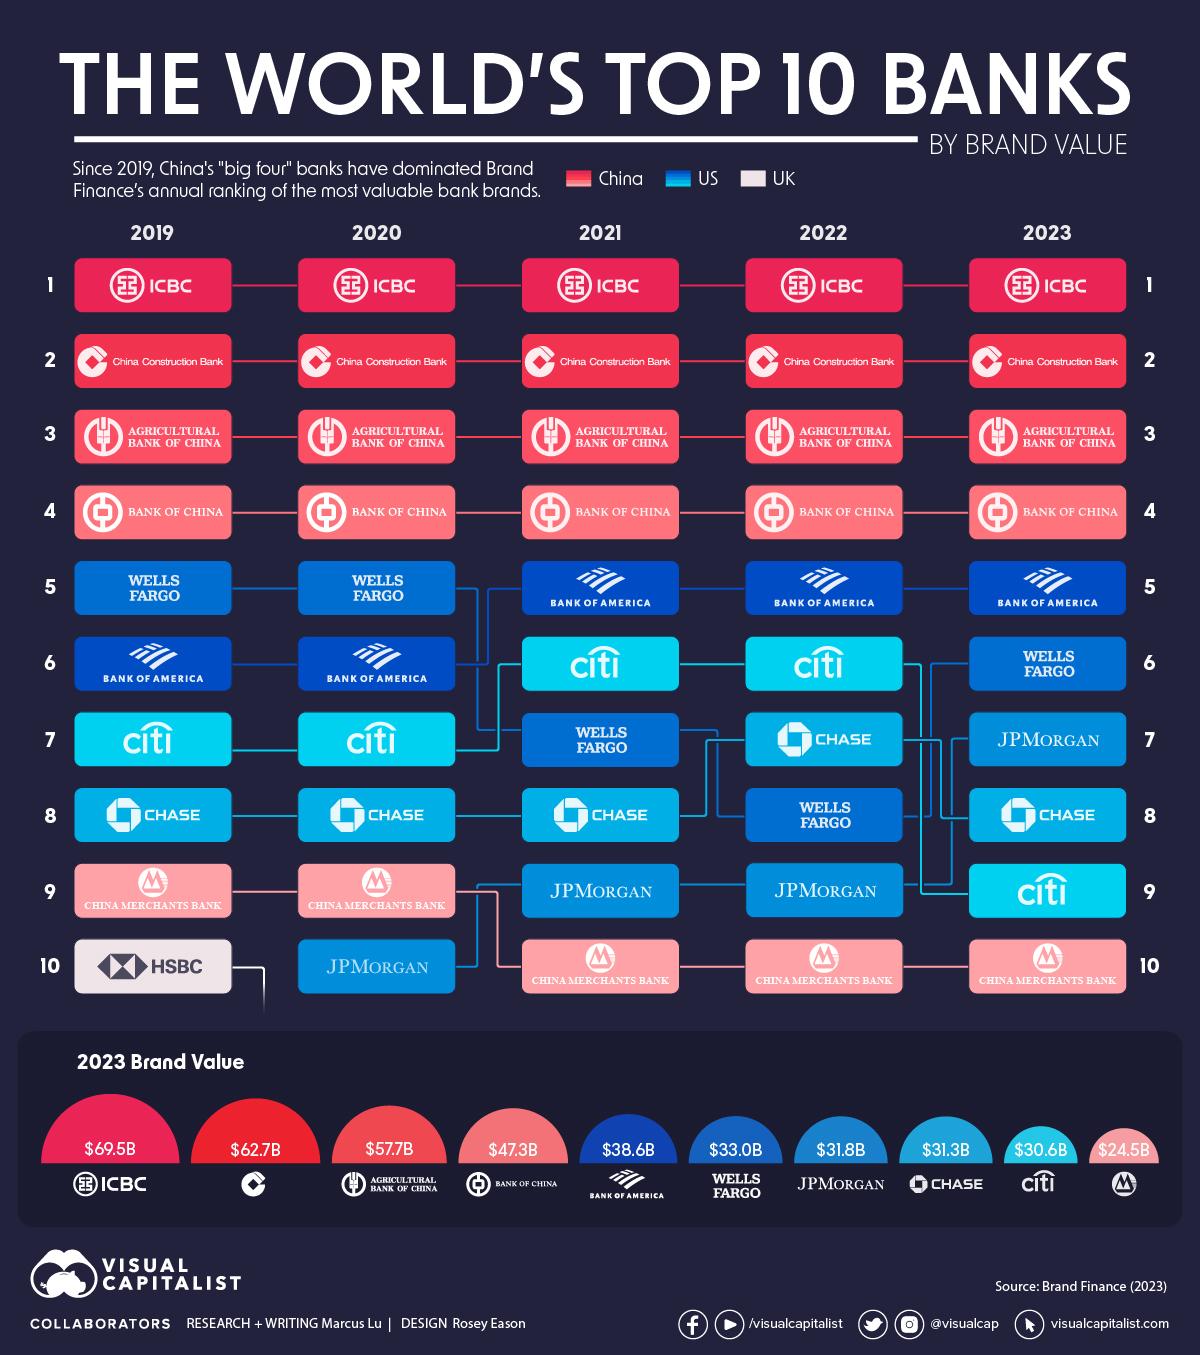


The World’s Most Valuable Bank Brands (2019-2023)
Since 2019, Chinese banks have held the top four spots on Brand Finance’s Banking 500—an annual ranking of the most valuable bank brands.
Brand value in this context is a measure of the “value of the trade mark and associated marketing IP within the branded business”. In other words, it measures the value of intangible marketing assets, and not the overall worth of the business itself.
In this infographic, we’ve visualized the Banking 500’s top 10 brands since 2019 to show you how the ranking has evolved (or stayed the same).
Top Bank Brands of 2023
The 10 most valuable bank brands of 2023 are evenly split between China and the United States. In terms of combined brand value, China leads with $262 billion to America’s $165 billion.
| Rank | Bank | Brand Value (USD billions) |
|---|---|---|
| 1 | 🇨🇳 ICBC | $69.5 |
| 2 | 🇨🇳 China Construction Bank | $62.7 |
| 3 | 🇨🇳 Agricultural Bank of China | $57.7 |
| 4 | 🇨🇳 Bank of China | $47.3 |
| 5 | 🇺🇸 Bank of America | $38.6 |
| 6 | 🇺🇸 Wells Fargo | $33.0 |
| 7 | 🇺🇸 JP Morgan | $31.8 |
| 8 | 🇺🇸 Chase | $31.3 |
| 9 | 🇺🇸 Citi | $30.6 |
| 10 | 🇨🇳 China Merchants Bank | $24.5 |
Chinese banks have a massive market to serve, which helps to lift the perceived value of their brands. For example, Industrial and Commercial Bank of China (ICBC) serves over 500 million individuals as well as several million business clients.
It’s worth noting that ICBC is the world’s largest bank in terms of assets under management ($5.5 trillion as of Dec 2021), and in terms of annual revenues ($143 billion as of Dec 2022). The bank was founded just 39 years ago in 1984.
After ICBC, the next three spots are occupied by the rest of China’s “big four” banks, all of which are state-owned.
The fifth to ninth spots on this ranking are occupied by an assortment of America’s largest banks. Despite a string of controversies in recent years, Wells Fargo rose from eighth in 2022 to sixth in 2023. This goes to show that large corporations can often recover from a scandal in a relatively short period of time (e.g. Volkswagen’s Dieselgate).
Coming in tenth is China Merchants Bank, which is China’s first “joint-stock commercial bank wholly owned by corporate legal entities”.
Top Asset Management Brands
Brand Finance’s 2023 ranking also includes a separate category for asset managers.
| Rank | Asset Manager | Brand Value (USD billions) |
|---|---|---|
| 1 | 🇨🇦 Brookfield | $9.0 |
| 2 | 🇺🇸 Fidelity | $8.4 |
| 3 | 🇺🇸 BlackRock | $6.6 |
| 4 | 🇺🇸 Blackstone | $4.9 |
| 5 | 🇨🇳 Cinda International Holdings Limited | $3.2 |
| 6 | 🇺🇸 Vanguard | $2.9 |
| 7 | 🇺🇸 Union Investment | $2.3 |
| 8 | 🇺🇸 Franklin Templeton Investments | $2.1 |
| 9 | 🇺🇸 Ameriprise Financial | $2.0 |
| 10 | 🇺🇸 Invesco | $1.5 |
Given America’s leadership in financial markets, it’s no surprise to see eight out of the 10 firms listed here as being based in the United States. The number one spot, however, is held by Canada’s Brookfield. The Canadian alternative asset manager is building a strong brand through its investments in renewable energy and other high-value infrastructure.


Markets
Mapped: Europe’s GDP Per Capita, by Country
Which European economies are richest on a GDP per capita basis? This map shows the results for 44 countries across the continent.


Mapped: Europe’s GDP Per Capita, by Country (2024)
This was originally posted on our Voronoi app. Download the app for free on iOS or Android and discover incredible data-driven charts from a variety of trusted sources.
Europe is home to some of the largest and most sophisticated economies in the world. But how do countries in the region compare with each other on a per capita productivity basis?
In this map, we show Europe’s GDP per capita levels across 44 nations in current U.S. dollars. Data for this visualization and article is sourced from the International Monetary Fund (IMF) via their DataMapper tool, updated April 2024.
Europe’s Richest and Poorest Nations, By GDP Per Capita
Luxembourg, Ireland, and Switzerland, lead the list of Europe’s richest nations by GDP per capita, all above $100,000.
| Rank | Country | GDP Per Capita (2024) |
|---|---|---|
| 1 | 🇱🇺 Luxembourg | $131,380 |
| 2 | 🇮🇪 Ireland | $106,060 |
| 3 | 🇨🇭 Switzerland | $105,670 |
| 4 | 🇳🇴 Norway | $94,660 |
| 5 | 🇮🇸 Iceland | $84,590 |
| 6 | 🇩🇰 Denmark | $68,900 |
| 7 | 🇳🇱 Netherlands | $63,750 |
| 8 | 🇸🇲 San Marino | $59,410 |
| 9 | 🇦🇹 Austria | $59,230 |
| 10 | 🇸🇪 Sweden | $58,530 |
| 11 | 🇧🇪 Belgium | $55,540 |
| 12 | 🇫🇮 Finland | $55,130 |
| 13 | 🇩🇪 Germany | $54,290 |
| 14 | 🇬🇧 UK | $51,070 |
| 15 | 🇫🇷 France | $47,360 |
| 16 | 🇦🇩 Andorra | $44,900 |
| 17 | 🇲🇹 Malta | $41,740 |
| 18 | 🇮🇹 Italy | $39,580 |
| 19 | 🇨🇾 Cyprus | $37,150 |
| 20 | 🇪🇸 Spain | $34,050 |
| 21 | 🇸🇮 Slovenia | $34,030 |
| 22 | 🇪🇪 Estonia | $31,850 |
| 23 | 🇨🇿 Czech Republic | $29,800 |
| 24 | 🇵🇹 Portugal | $28,970 |
| 25 | 🇱🇹 Lithuania | $28,410 |
| 26 | 🇸🇰 Slovakia | $25,930 |
| 27 | 🇱🇻 Latvia | $24,190 |
| 28 | 🇬🇷 Greece | $23,970 |
| 29 | 🇭🇺 Hungary | $23,320 |
| 30 | 🇵🇱 Poland | $23,010 |
| 31 | 🇭🇷 Croatia | $22,970 |
| 32 | 🇷🇴 Romania | $19,530 |
| 33 | 🇧🇬 Bulgaria | $16,940 |
| 34 | 🇷🇺 Russia | $14,390 |
| 35 | 🇹🇷 Türkiye | $12,760 |
| 36 | 🇲🇪 Montenegro | $12,650 |
| 37 | 🇷🇸 Serbia | $12,380 |
| 38 | 🇦🇱 Albania | $8,920 |
| 39 | 🇧🇦 Bosnia & Herzegovina | $8,420 |
| 40 | 🇲🇰 North Macedonia | $7,690 |
| 41 | 🇧🇾 Belarus | $7,560 |
| 42 | 🇲🇩 Moldova | $7,490 |
| 43 | 🇽🇰 Kosovo | $6,390 |
| 44 | 🇺🇦 Ukraine | $5,660 |
| N/A | 🇪🇺 EU Average | $44,200 |
Note: Figures are rounded.
Three Nordic countries (Norway, Iceland, Denmark) also place highly, between $70,000-90,000. Other Nordic peers, Sweden and Finland rank just outside the top 10, between $55,000-60,000.
Meanwhile, Europe’s biggest economies in absolute terms, Germany, UK, and France, rank closer to the middle of the top 20, with GDP per capitas around $50,000.
Finally, at the end of the scale, Eastern Europe as a whole tends to have much lower per capita GDPs. In that group, Ukraine ranks last, at $5,660.
A Closer Look at Ukraine
For a broader comparison, Ukraine’s per capita GDP is similar to Iran ($5,310), El Salvador ($5,540), and Guatemala ($5,680).
According to experts, Ukraine’s economy has historically underperformed to expectations. After the fall of the Berlin Wall, the economy contracted for five straight years. Its transition to a Western, liberalized economic structure was overshadowed by widespread corruption, a limited taxpool, and few revenue sources.
Politically, its transformation from authoritarian regime to civil democracy has proved difficult, especially when it comes to institution building.
Finally, after the 2022 invasion of the country, Ukraine’s GDP contracted by 30% in a single year—the largest loss since independence. Large scale emigration—to the tune of six million refugees—is also playing a role.
Despite these challenges, the country’s economic growth has somewhat stabilized while fighting continues.

-

 Brands5 days ago
The Evolution of U.S. Beer Logos
-

 Culture2 weeks ago
The World’s Top Media Franchises by All-Time Revenue
-

 voronoi2 weeks ago
Best Visualizations of April on the Voronoi App
-

 Wealth2 weeks ago
Charted: Which Country Has the Most Billionaires in 2024?
-

 Business1 week ago
The Top Private Equity Firms by Country
-

 Markets1 week ago
The Best U.S. Companies to Work for According to LinkedIn
-

 Economy1 week ago
Ranked: The Top 20 Countries in Debt to China
-

 Politics1 week ago
Charted: Trust in Government Institutions by G7 Countries