Energy
Ranked: The World’s Top Cobalt Producing Countries
![]() Subscribe to the Elements free mailing list for more like this
Subscribe to the Elements free mailing list for more like this


Ranked: The World’s Top Cobalt Producing Countries
This was originally posted on Elements. Sign up to the free mailing list to get beautiful visualizations on real assets and resource megatrends each week.
Cobalt, an essential component of key chemistries of the rechargeable lithium-ion batteries used in EVs, has seen a significant shift in its global production landscape.
The Democratic Republic of Congo (DRC) has long been the world’s largest cobalt producer, accounting for 73% of global output in 2022.
However, according to the Cobalt Institute, the DRC’s dominance is projected to decrease to 57% by 2030 as Indonesia ramps up its cobalt production as a byproduct from its rapidly expanding nickel industry.
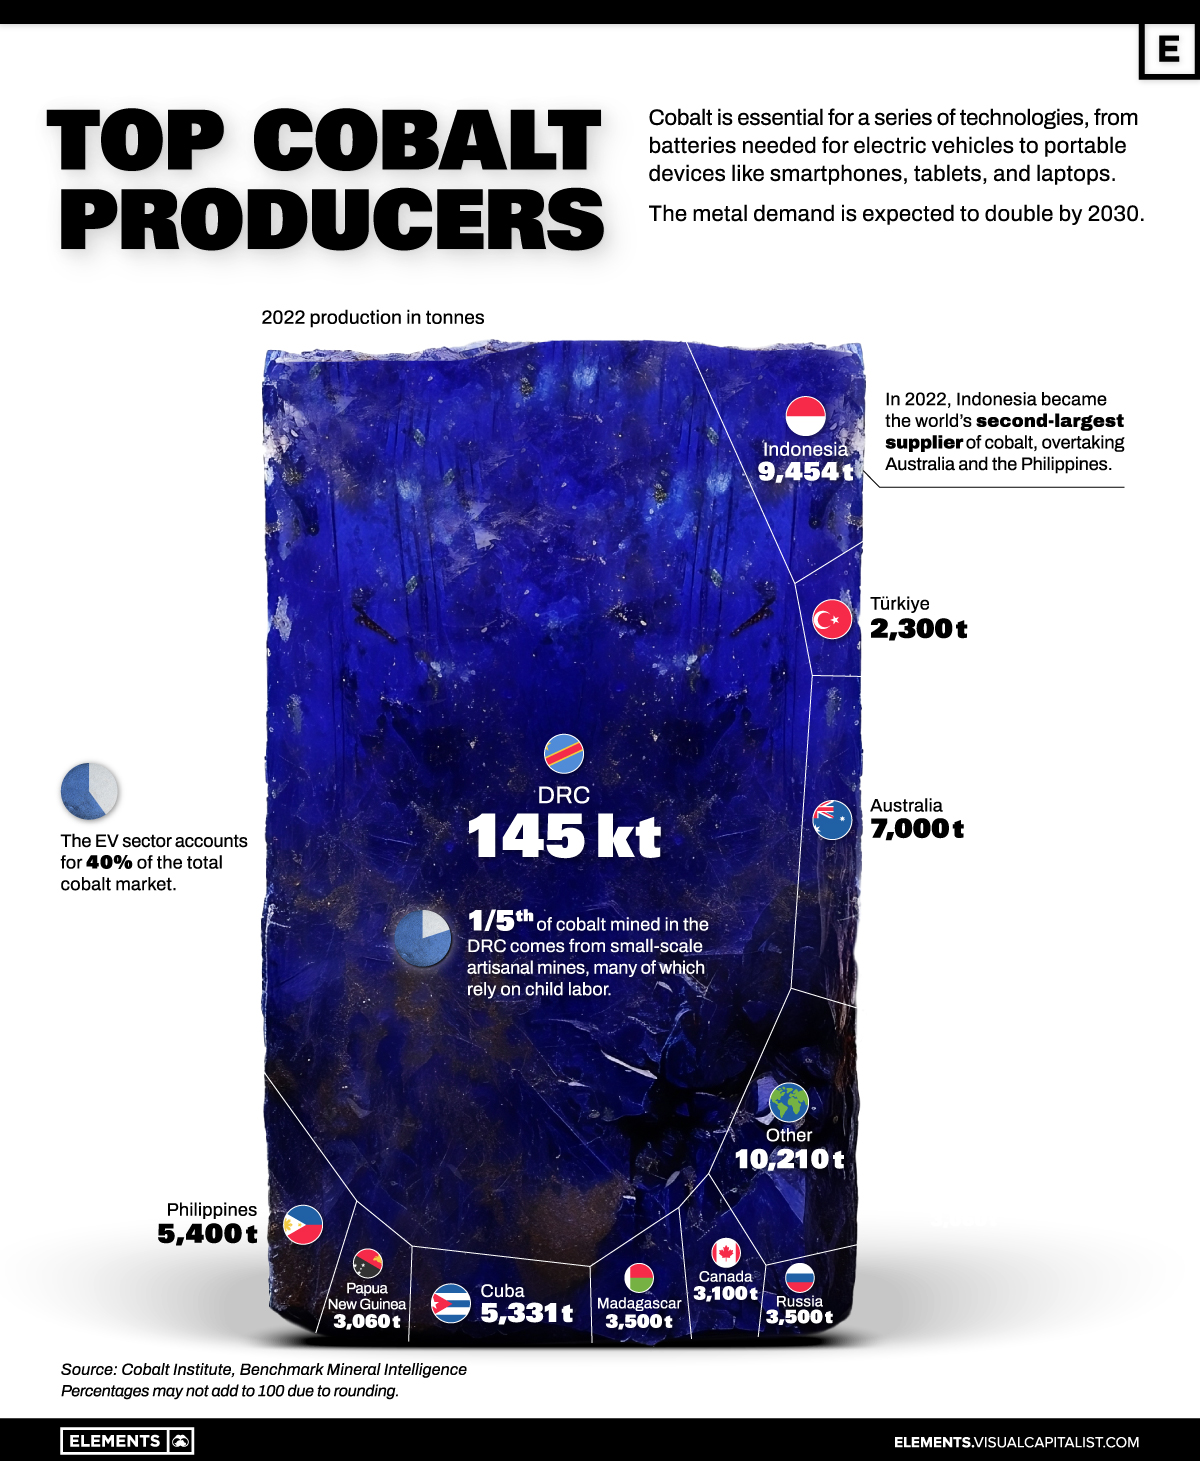
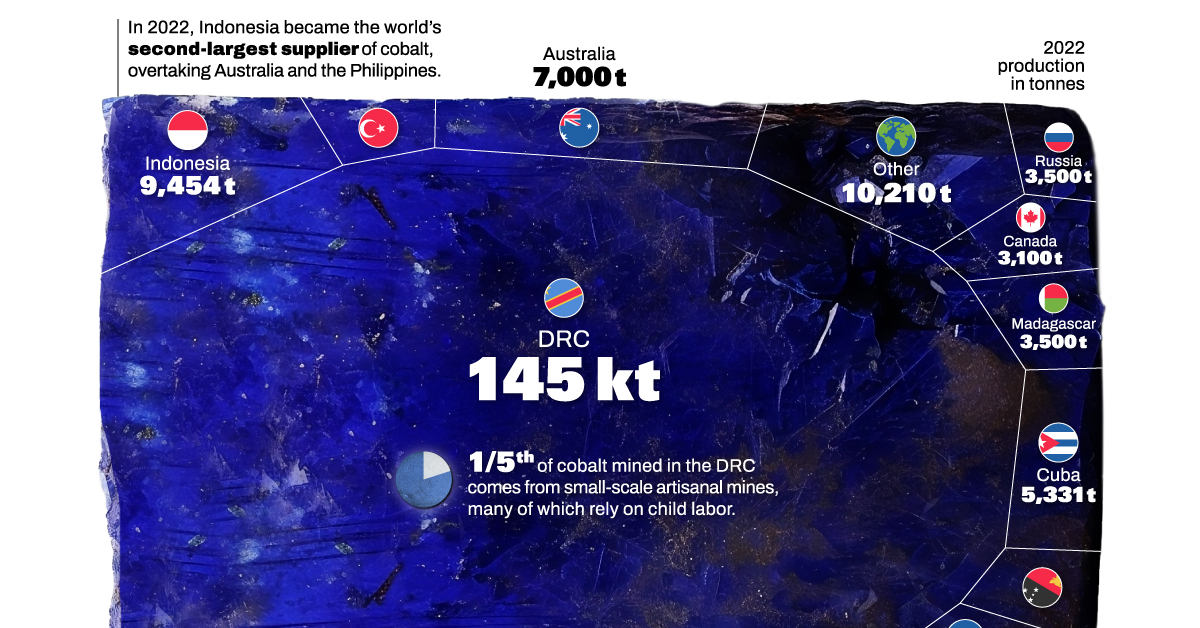
Indonesia Became Second Largest Cobalt Producer in 2022
Indonesia accounts for nearly 5% of global cobalt production today, surpassing established producers like Australia and the Philippines.
In 2022, Indonesia’s cobalt production surged to almost 9,500 tonnes from 2,700 tonnes in 2021, with the potential to increase production by tenfold by 2030.
| Country | 2022 Production (tonnes) | % of Total Production |
|---|---|---|
| 🇨🇩 DRC | 144,936 | 73.3% |
| 🇮🇩 Indonesia | 9,454 | 4.8% |
| 🇦🇺 Australia | 7,000 | 3.5% |
| 🇵🇭 Philippines | 5,400 | 2.7% |
| 🇨🇺 Cuba | 5,331 | 2.7% |
| 🇷🇺 Russia | 3,500 | 1.8% |
| 🇲🇬 Madagascar | 3,500 | 1.8% |
| 🇨🇦 Canada | 3,100 | 1.6% |
| 🇵🇬 Papua New Guinea | 3,060 | 1.5% |
| 🇹🇷 Türkiye | 2,300 | 1.2% |
| 🌐 Other | 10,210 | 5.2% |
| Total | 197,791 | 100.0% |
Percentages may not add to 100 due to rounding.
In total, global cobalt production reached 197,791 tonnes, with the DRC contributing just under 145,000 tonnes of that mix.
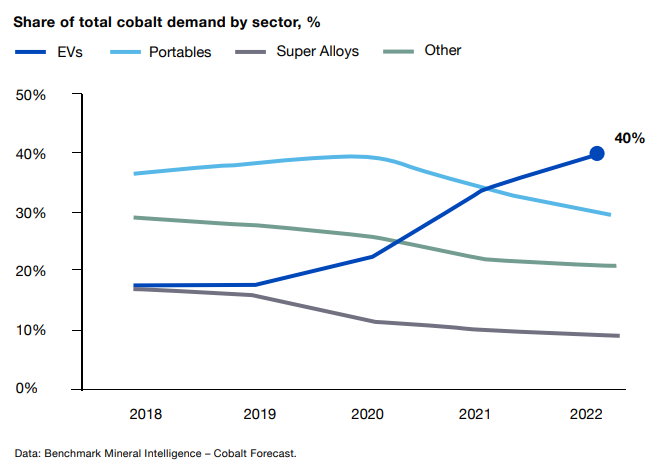
The EV industry is the largest consumer of cobalt, accounting for approximately 40% of total demand. The exponential growth of the EV sector is expected to drive a doubling of global cobalt demand by 2030.
While the shift in cobalt production is notable, it is not without challenges. Plummeting cobalt prices, which fell almost 30% this year to $13.90 a pound, have severely impacted the DRC.
Furthermore, the longer-term prospects of cobalt could face hurdles due to efforts to reduce its use in batteries, partly driven by human rights concerns associated with artisanal cobalt mining in the DRC and related child labor and human rights abuses.
In a 2021 ruling by a federal court in Washington, Google parent Alphabet, Apple, Dell, Microsoft, and Tesla were relieved from a class action suit claiming their responsibility for alleged child labor in Congolese cobalt mines.
The Future of Cobalt
Despite ongoing efforts to substitute cobalt in battery applications, cobalt is expected to remain a vital raw material for the entire battery supply chain in the near future.
The demand for cobalt is forecasted to more than double by 2030 to 388,000 tonnes.


Who’s Building the Most Solar Energy?
This was originally posted on our Voronoi app. Download the app for free on iOS or Android and discover incredible data-driven charts from a variety of trusted sources.
In 2023, solar energy accounted for three-quarters of renewable capacity additions worldwide. Most of this growth occurred in Asia, the EU, and the U.S., continuing a trend observed over the past decade.
In this graphic, we illustrate the rise in installed solar photovoltaic (PV) capacity in China, the EU, and the U.S. between 2010 and 2022, measured in gigawatts (GW). Bruegel compiled the data..
Chinese Dominance
As of 2022, China’s total installed capacity stands at 393 GW, nearly double that of the EU’s 205 GW and surpassing the USA’s total of 113 GW by more than threefold in absolute terms.
| Installed solar capacity (GW) | China | EU27 | U.S. |
|---|---|---|---|
| 2022 | 393.0 | 205.5 | 113.0 |
| 2021 | 307.0 | 162.7 | 95.4 |
| 2020 | 254.0 | 136.9 | 76.4 |
| 2019 | 205.0 | 120.1 | 61.6 |
| 2018 | 175.3 | 104.0 | 52.0 |
| 2017 | 130.8 | 96.2 | 43.8 |
| 2016 | 77.8 | 91.5 | 35.4 |
| 2015 | 43.6 | 87.7 | 24.2 |
| 2014 | 28.4 | 83.6 | 18.1 |
| 2013 | 17.8 | 79.7 | 13.3 |
| 2012 | 6.7 | 71.1 | 8.6 |
| 2011 | 3.1 | 53.3 | 5.6 |
| 2010 | 1.0 | 30.6 | 3.4 |
Since 2017, China has shown a compound annual growth rate (CAGR) of approximately 25% in installed PV capacity, while the USA has seen a CAGR of 21%, and the EU of 16%.
Additionally, China dominates the production of solar power components, currently controlling around 80% of the world’s solar panel supply chain.
In 2022, China’s solar industry employed 2.76 million individuals, with manufacturing roles representing approximately 1.8 million and the remaining 918,000 jobs in construction, installation, and operations and maintenance.
The EU industry employed 648,000 individuals, while the U.S. reached 264,000 jobs.
According to the IEA, China accounts for almost 60% of new renewable capacity expected to become operational globally by 2028.
Despite the phasing out of national subsidies in 2020 and 2021, deployment of solar PV in China is accelerating. The country is expected to reach its national 2030 target for wind and solar PV installations in 2024, six years ahead of schedule.

-

 Markets6 days ago
Mapped: Europe’s GDP Per Capita, by Country
-

 Energy2 weeks ago
Mapped: The Age of Energy Projects in Interconnection Queues, by State
-

 Mining2 weeks ago
Visualizing Global Gold Production in 2023
-

 Markets2 weeks ago
Visualized: Interest Rate Forecasts for Advanced Economies
-

 Markets2 weeks ago
The Most Valuable Companies in Major EU Economies
-

 Markets1 week ago
The World’s Fastest Growing Emerging Markets (2024-2029 Forecast)
-

 Markets1 week ago
Visualizing Global Inflation Forecasts (2024-2026)
-

 United States1 week ago
Charted: What Southeast Asia Thinks About China & the U.S.