United States
Ranked: The Top Economies in the World (1980‒2075)


Visualizing the Top Economies in the World
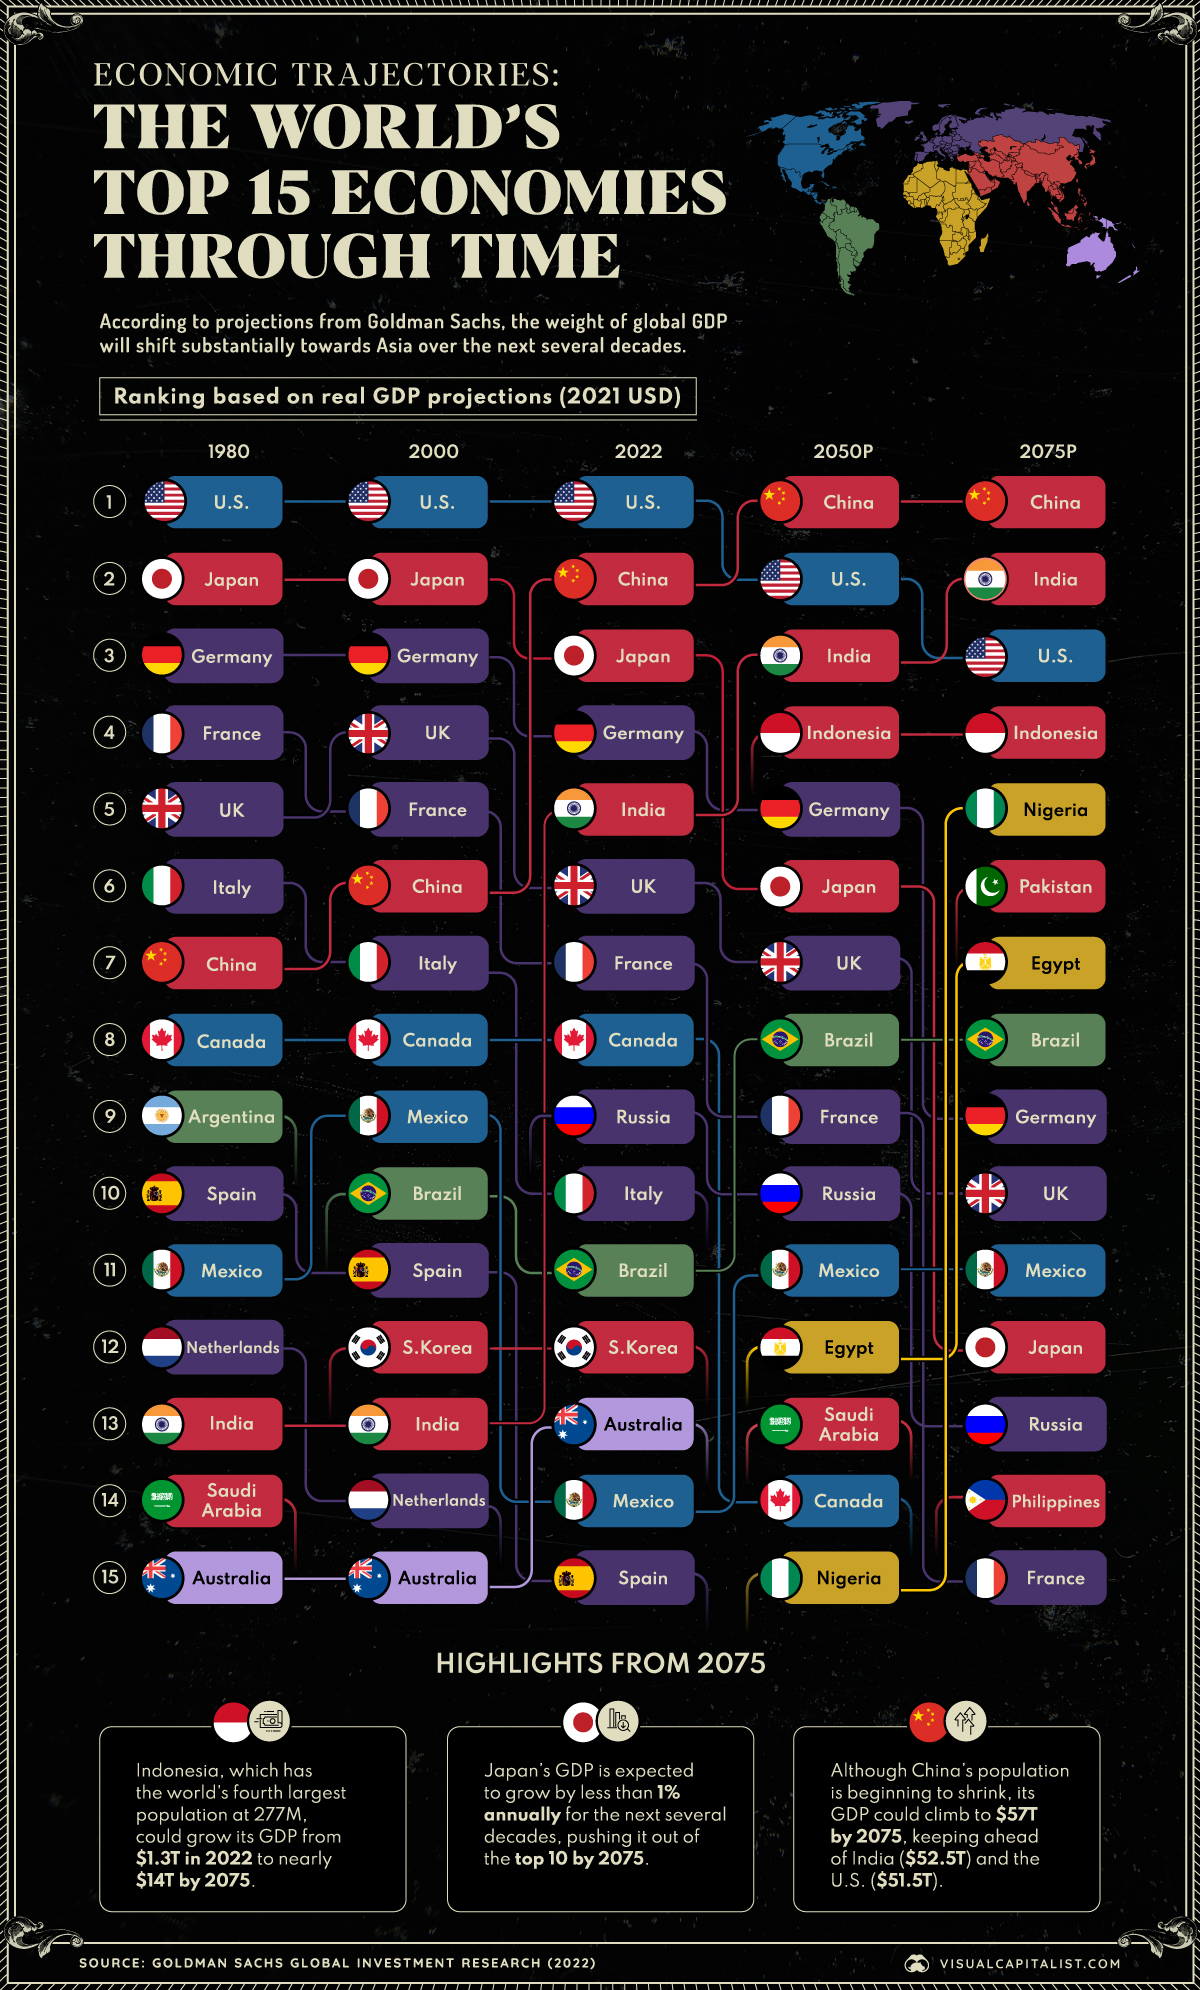
According to a recent report from Goldman Sachs, the balance of global economic power is projected to shift dramatically in the coming decades.
In the graphic above, we’ve created a bump chart that provides a historical and predictive overview of the world’s top 15 economies at several milestones: 1980, 2000, 2022, and Goldman Sachs projections for 2050 and 2075.
Projections and Highlights for 2050
The following table shows the projected top economies in the world for 2050. All figures represent real GDP projections, based on 2021 USD.
| Rank | Country | Real GDP in 2050 (USD trillions) |
|---|---|---|
| 1 | 🇨🇳 China | $41.9 |
| 2 | 🇺🇸 US | $37.2 |
| 3 | 🇮🇳 India | $22.2 |
| 4 | 🇮🇩 Indonesia | $6.3 |
| 5 | 🇩🇪 Germany | $6.2 |
| 6 | 🇯🇵 Japan | $6.0 |
| 7 | 🇬🇧 UK | $5.2 |
| 8 | 🇧🇷 Brazil | $4.9 |
| 9 | 🇫🇷 France | $4.6 |
| 10 | 🇷🇺 Russia | $4.5 |
| 11 | 🇲🇽 Mexico | $4.2 |
| 12 | 🇪🇬 Egypt | $3.5 |
| 13 | 🇸🇦 Saudi Arabia | $3.5 |
| 14 | 🇨🇦 Canada | $3.4 |
| 15 | 🇳🇬 Nigeria | $3.4 |
A major theme of the past several decades has been China and India’s incredible growth. For instance, between 2000 and 2022, India jumped eight spots to become the fifth largest economy, surpassing the UK and France.
By 2050, Goldman Sachs believes that the weight of global GDP will shift even more towards Asia. While this is partly due to Asia outperforming previous forecasts, it is also due to BRICS nations underperforming.
Notably, Indonesia will become the fourth biggest economy by 2050, surpassing Brazil and Russia as the largest emerging market. Indonesia is the world’s largest archipelagic state, and currently has the fourth largest population at 277 million.
The Top Economies in the World in 2075
The following table includes the underlying numbers for 2075. Once again, figures represent real GDP projections, based on 2021 USD.
| Rank | Country | Real GDP in 2075 (USD trillions) |
|---|---|---|
| 1 | 🇨🇳 China | $57.0 |
| 2 | 🇮🇳 India | $52.5 |
| 3 | 🇺🇸 US | $51.5 |
| 4 | 🇮🇩 Indonesia | $13.7 |
| 5 | 🇳🇬 Nigeria | $13.1 |
| 6 | 🇵🇰 Pakistan | $12.3 |
| 7 | 🇪🇬 Egypt | $10.4 |
| 8 | 🇧🇷 Brazil | $8.7 |
| 9 | 🇩🇪 Germany | $8.1 |
| 10 | 🇬🇧 UK | $7.6 |
| 11 | 🇲🇽 Mexico | $7.6 |
| 12 | 🇯🇵 Japan | $7.5 |
| 13 | 🇷🇺 Russia | $6.9 |
| 14 | 🇵🇭 Philippines | $6.6 |
| 15 | 🇫🇷 France | $6.5 |
Projecting further to 2075 reveals a drastically different world order, with Nigeria, Pakistan, and Egypt breaking into the top 10. A major consideration in these estimates is rapid population growth, which should result in a massive labor force across all three nations.
Meanwhile, European economies will continue to slip further down the rankings. Germany, which was once the world’s third largest economy, will sit at ninth behind Brazil.
It should also be noted that China, India, and the U.S. are expected to have similar GDPs by this time, suggesting somewhat equal economic power. As a result, how these nations choose to engage with one another is likely to shape the global landscape in ways that have far-reaching implications.


Wealth
Visualizing the Tax Burden of Every U.S. State
Tax burden measures the percent of an individual’s income that is paid towards taxes. See where it’s the highest by state in this graphic.


Visualizing the Tax Burden of Every U.S. State
This was originally posted on our Voronoi app. Download the app for free on iOS or Android and discover incredible data-driven charts from a variety of trusted sources.
This map graphic visualizes the total tax burden in each U.S. state as of March 2024, based on figures compiled by WalletHub.
It’s important to understand that under this methodology, the tax burden measures the percent of an average person’s income that is paid towards state and local taxes. It considers property taxes, income taxes, and sales & excise tax.
Data and Methodology
The figures we used to create this graphic are listed in the table below.
| State | Total Tax Burden |
|---|---|
| New York | 12.0% |
| Hawaii | 11.8% |
| Vermont | 11.1% |
| Maine | 10.7% |
| California | 10.4% |
| Connecticut | 10.1% |
| Minnesota | 10.0% |
| Illinois | 9.7% |
| New Jersey | 9.5% |
| Rhode Island | 9.4% |
| Utah | 9.4% |
| Kansas | 9.3% |
| Maryland | 9.3% |
| Iowa | 9.2% |
| Nebraska | 9.2% |
| Ohio | 8.9% |
| Indiana | 8.9% |
| Arkansas | 8.8% |
| Mississippi | 8.8% |
| Massachusetts | 8.6% |
| Virginia | 8.5% |
| West Virginia | 8.5% |
| Oregon | 8.4% |
| Colorado | 8.4% |
| Pennsylvania | 8.4% |
| Wisconsin | 8.3% |
| Louisiana | 8.3% |
| Kentucky | 8.3% |
| Washington | 8.0% |
| New Mexico | 8.0% |
| Michigan | 8.0% |
| North Carolina | 7.9% |
| Idaho | 7.9% |
| Arizona | 7.8% |
| Missouri | 7.8% |
| Georgia | 7.7% |
| Texas | 7.6% |
| Alabama | 7.5% |
| Montana | 7.5% |
| South Carolina | 7.5% |
| Nevada | 7.4% |
| Oklahoma | 7.0% |
| North Dakota | 6.8% |
| South Dakota | 6.4% |
| Delaware | 6.4% |
| Tennessee | 6.1% |
| Florida | 6.1% |
| Wyoming | 5.7% |
| New Hampshire | 5.6% |
| Alaska | 4.9% |
From this data we can see that New York has the highest total tax burden. Residents in this state will pay, on average, 12% of their income to state and local governments.
Breaking this down into its three components, the average New Yorker pays 4.6% of their income on income taxes, 4.4% on property taxes, and 3% in sales & excise taxes.
At the other end of the spectrum, Alaska has the lowest tax burden of any state, equaling 4.9% of income. This is partly due to the fact that Alaskans do not pay state income tax.
Hate Paying Taxes?
In addition to Alaska, there are several other U.S. states that don’t charge income taxes. These are: Florida, Nevada, South Dakota, Tennessee, Texas, Washington, and Wyoming.
It’s also worth noting that New Hampshire does not have a regular income tax, but does charge a flat 4% on interest and dividend income according to the Tax Foundation.
Learn More About Taxation From Visual Capitalist
If you enjoyed this post, be sure to check out this graphic which ranks the countries with the lowest corporate tax rates, from 1980 to today.

-

 Markets6 days ago
The World’s Fastest Growing Emerging Markets (2024-2029 Forecast)
-

 Technology2 weeks ago
All of the Grants Given by the U.S. CHIPS Act
-

 Green2 weeks ago
The Carbon Footprint of Major Travel Methods
-

 United States2 weeks ago
Visualizing the Most Common Pets in the U.S.
-

 Culture2 weeks ago
The World’s Top Media Franchises by All-Time Revenue
-

 Visual Capitalist1 week ago
Best Visualizations of April on the Voronoi App
-

 Wealth1 week ago
Charted: Which Country Has the Most Billionaires in 2024?
-

 Markets1 week ago
The Top Private Equity Firms by Country