

Energy Shift
Which Countries Are Most Reliant on Coal?
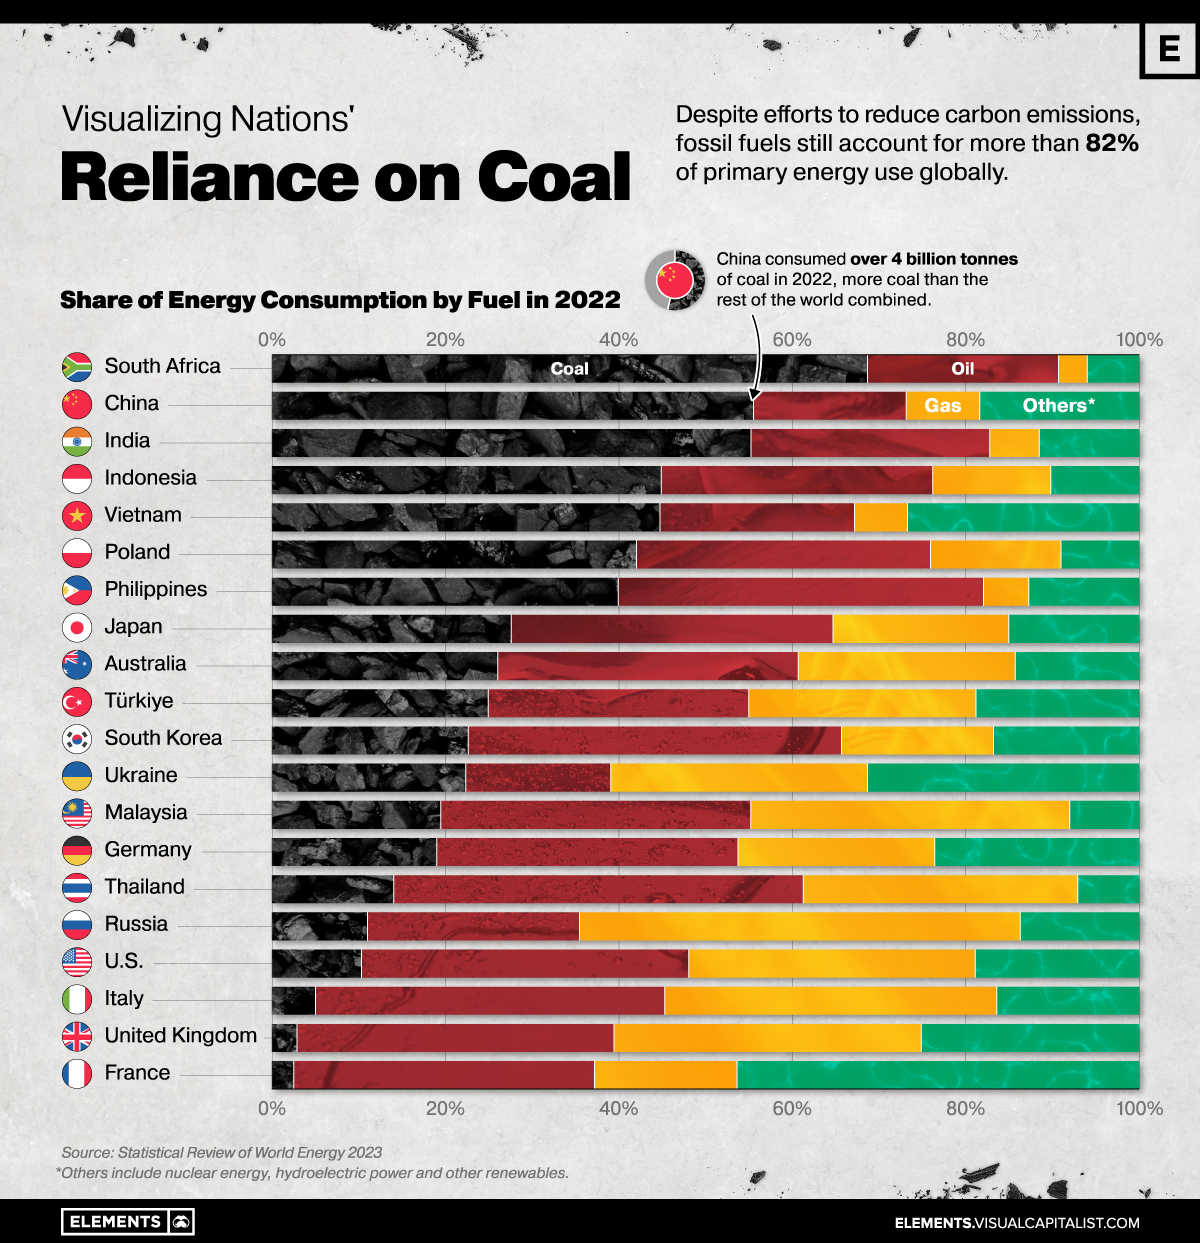


Which Countries Are Most Reliant on Coal?
Global energy policies and discussions in recent years have been focused on the importance of decarbonizing the energy system in the transition to net zero.
However, despite efforts to reduce carbon emissions, fossil fuels still account for more than 80% of primary energy use globally—and coal, the world’s most affordable energy fuel, is also the largest source of energy-related CO2 emissions.
The graphic above uses data from the Statistical Review of World Energy to show how much select countries rely on fossil fuels, particularly coal.
Coal’s Importance in Emerging Economies
Coal is the largest source of electricity generation and the primary fuel for iron, steel, and cement production, making it central to climate and energy discussions.
The fossil fuel continues to be an affordable and abundant source of energy, particularly in emerging economies where demand is expanding rapidly.
South Africa is the world’s most coal-dependent nation featured in the statistical review, with coal accounting for 69% of its primary energy consumption in 2022.
| Primary energy use, by fuel type (2022) | ||||
|---|---|---|---|---|
| Country | Coal % | Oil % | Gas % | Other % |
| 🇿🇦 South Africa | 69% | 22% | 3% | 6% |
| 🇨🇳 China | 55% | 18% | 8% | 18% |
| 🇮🇳 India | 55% | 27% | 6% | 11% |
| 🇮🇩 Indonesia | 45% | 31% | 14% | 10% |
| 🇻🇳 Vietnam | 45% | 22% | 6% | 27% |
| 🇵🇱 Poland | 42% | 34% | 15% | 9% |
| 🇵🇭 Philippines | 40% | 42% | 5% | 13% |
| 🇯🇵 Japan | 27% | 37% | 20% | 15% |
| 🇦🇺 Australia | 26% | 35% | 25% | 14% |
| 🇹🇷 Türkiye | 25% | 30% | 26% | 19% |
| 🇰🇷 South Korea | 23% | 43% | 17% | 17% |
| 🇺🇦 Ukraine | 22% | 17% | 30% | 31% |
| 🇲🇾 Malaysia | 19% | 36% | 37% | 8% |
| 🇩🇪 Germany | 19% | 35% | 23% | 23% |
| 🇹🇭 Thailand | 14% | 47% | 32% | 7% |
| 🇷🇺 Russia | 11% | 24% | 51% | 14% |
| 🇺🇸 U.S. | 10% | 38% | 33% | 19% |
| 🇮🇹 Italy | 5% | 40% | 38% | 16% |
| 🇬🇧 United Kingdom | 3% | 36% | 35% | 25% |
| 🇫🇷 France | 2% | 35% | 16% | 46% |
Percentages may not add to 100 due to rounding. Select countries shown above.
In 2022, global consumption of coal surpassed 8 billion tonnes in a single year for the first time, with China and India being the two biggest consumers in absolute terms.
China’s power sector alone accounts for one-third of global coal consumption. Meanwhile, with a growth rate of 6% annually, India has doubled its coal consumption since 2007—and is expected to lead the growth in coal consumption for years to come.
Coal Demand in Developed Countries
U.S. consumption of coal has dropped almost 50% compared to the early 2010s.
With initiatives like the Inflation Reduction Act (IRA), which includes nearly $370 billion to accelerate the U.S.’s energy transition, coal consumption is expected to remain on a downward trajectory in the United States.
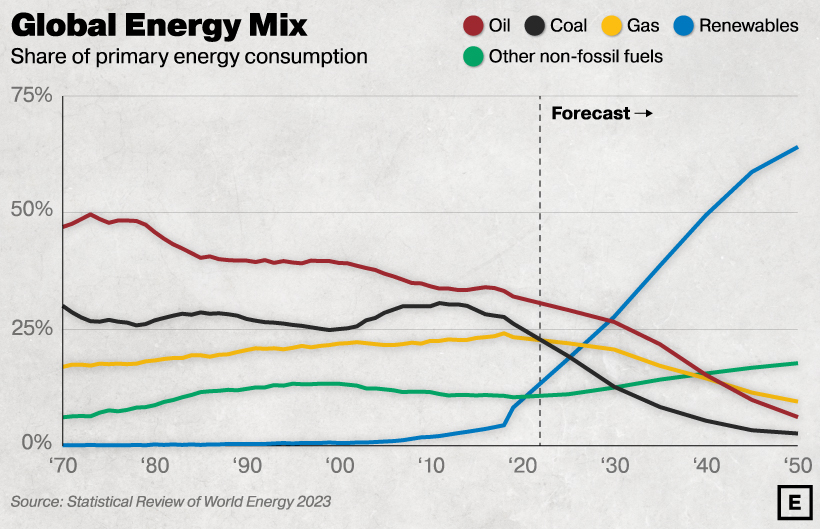
Source: BP Energy Outlook 2023. The forecast is based on BP’s scenario for global net-zero emissions by 2050.
The same movement is seen in the European Union.
France, for example, only has 2.5% of its primary energy consumption coming from coal, a share that is just half of what it was in the early 2000s.
In Germany, Europe’s biggest economy, coal still accounts for 18.9% of total energy consumption (a small increase over 2021, due to the energy crisis). However, a decade ago in 2012, that number stood even higher at 24.9% of primary energy use.
With coal consumption falling in developed nations but remaining steady in emerging economies, the International Energy Agency projects that coal demand will plateau at 2022 levels until 2025 when it will begin to fall.


Energy Shift
Visualizing Copper Production by Country in 2023
Chile and Peru account for one-third of the world’s copper output.

Visualizing Copper Production by Country in 2023
This was originally posted on our Voronoi app. Download the app for free on iOS or Android and discover incredible data-driven charts from a variety of trusted sources.
Copper is considered an essential metal for the clean energy transition because it is a great conductor of electricity.
As a result, governments around the world have been encouraging the construction of new mines, and mining companies have been seeking new projects and acquiring existing mines to meet the growing demand.
In this graphic, we illustrate global copper production in 2023, based on data from the U.S. Geological Survey, Mineral Commodity Summaries, as of January 2024.
Most Copper Comes from South America
Chile and Peru account for one-third of the world’s copper output.
| Country | Region | 2023E Production (Million tonnes) |
|---|---|---|
| 🇨🇱 Chile | South America | 5.0 |
| 🇵🇪 Peru | South America | 2.6 |
| 🇨🇩 Congo (Kinshasa) | Africa | 2.5 |
| 🇨🇳 China | Asia | 1.7 |
| 🇺🇸 United States | North America | 1.1 |
| 🇷🇺 Russia | Europe/Asia | 0.9 |
| 🇦🇺 Australia | Oceania | 0.8 |
| 🇮🇩 Indonesia | Asia | 0.8 |
| 🇿🇲 Zambia | Africa | 0.8 |
| 🇲🇽 Mexico | North America | 0.7 |
| 🇰🇿 Kazakhstan | Asia | 0.6 |
| 🇨🇦 Canada | North America | 0.5 |
| 🇵🇱 Poland | Europe | 0.4 |
| 🌍 Rest of World | -- | 3.1 |
| World total (rounded) | -- | 21.5 |
Chile is also home to the two largest mines in the world, Escondida and Collahuasi.
Meanwhile, African countries have rapidly increased their production. The Democratic Republic of Congo, for example, transitioned from being a secondary copper producer in the late 1990s to becoming the third-largest producer by 2023.
Part of the growth in copper mining in Africa is attributed to high investment from China. Chinese mining companies represent 8% of Africa’s total output in the mining sector.
Within its territory, China has also seen a 277% growth in copper production over the last three decades.
In the U.S., Arizona is the leading copper-producing state, accounting for approximately 70% of domestic output. Copper is also mined in Michigan, Missouri, Montana, Nevada, New Mexico, and Utah.
Energy Shift
Who’s Building the Most Solar Energy?
China’s solar capacity triples USA, nearly doubles EU.

Who’s Building the Most Solar Energy?
This was originally posted on our Voronoi app. Download the app for free on iOS or Android and discover incredible data-driven charts from a variety of trusted sources.
In 2023, solar energy accounted for three-quarters of renewable capacity additions worldwide. Most of this growth occurred in Asia, the EU, and the U.S., continuing a trend observed over the past decade.
In this graphic, we illustrate the rise in installed solar photovoltaic (PV) capacity in China, the EU, and the U.S. between 2010 and 2022, measured in gigawatts (GW). Bruegel compiled the data..
Chinese Dominance
As of 2022, China’s total installed capacity stands at 393 GW, nearly double that of the EU’s 205 GW and surpassing the USA’s total of 113 GW by more than threefold in absolute terms.
| Installed solar capacity (GW) | China | EU27 | U.S. |
|---|---|---|---|
| 2022 | 393.0 | 205.5 | 113.0 |
| 2021 | 307.0 | 162.7 | 95.4 |
| 2020 | 254.0 | 136.9 | 76.4 |
| 2019 | 205.0 | 120.1 | 61.6 |
| 2018 | 175.3 | 104.0 | 52.0 |
| 2017 | 130.8 | 96.2 | 43.8 |
| 2016 | 77.8 | 91.5 | 35.4 |
| 2015 | 43.6 | 87.7 | 24.2 |
| 2014 | 28.4 | 83.6 | 18.1 |
| 2013 | 17.8 | 79.7 | 13.3 |
| 2012 | 6.7 | 71.1 | 8.6 |
| 2011 | 3.1 | 53.3 | 5.6 |
| 2010 | 1.0 | 30.6 | 3.4 |
Since 2017, China has shown a compound annual growth rate (CAGR) of approximately 25% in installed PV capacity, while the USA has seen a CAGR of 21%, and the EU of 16%.
Additionally, China dominates the production of solar power components, currently controlling around 80% of the world’s solar panel supply chain.
In 2022, China’s solar industry employed 2.76 million individuals, with manufacturing roles representing approximately 1.8 million and the remaining 918,000 jobs in construction, installation, and operations and maintenance.
The EU industry employed 648,000 individuals, while the U.S. reached 264,000 jobs.
According to the IEA, China accounts for almost 60% of new renewable capacity expected to become operational globally by 2028.
Despite the phasing out of national subsidies in 2020 and 2021, deployment of solar PV in China is accelerating. The country is expected to reach its national 2030 target for wind and solar PV installations in 2024, six years ahead of schedule.

-

 Electrification3 years ago
Ranked: The Top 10 EV Battery Manufacturers
-

 Electrification2 years ago
The Key Minerals in an EV Battery
-

 Real Assets3 years ago
The World’s Top 10 Gold Mining Companies
-

 Electrification2 years ago
Mapped: Solar Power by Country in 2021
-

 Misc3 years ago
All the Metals We Mined in One Visualization
-

 Energy Shift2 years ago
What Are the Five Major Types of Renewable Energy?
-

 Electrification2 years ago
The World’s Largest Nickel Mining Companies
-

 Misc3 years ago
The Largest Copper Mines in the World by Capacity