

Energy Shift
How Far Are We From Phasing Out Coal?

How Far Are We from Phasing Out Coal?
At the COP26 conference last year, 40 nations agreed to phase coal out of their energy mixes.
Despite this, in 2021, coal-fired electricity generation reached all-time highs globally, showing that eliminating coal from the energy mix will not be a simple task.
This infographic shows the aggressive phase-out of coal power that would be required in order to reach net zero goals by 2050, based on an analysis by Ember that uses data provided by the International Energy Agency (IEA).
Low-Cost Comes at a High Environmental Cost
Coal-powered electricity generation rose by 9.0% in 2021 to 10,042 Terawatt-hours (TWh), marking the biggest percentage rise since 1985.
The main reason is cost. Coal is the world’s most affordable energy fuel. Unfortunately, low-cost energy comes at a high cost for the environment, with coal being the largest source of energy-related CO2 emissions.
China has the highest coal consumption, making up 54% of the world’s coal electricity generation. The country’s consumption jumped 12% between 2010 and 2020, despite coal making up a lower percentage of the country’s energy mix in relative terms.
| Top Consumers | 2020 Consumption (Exajoules) | Share of global consumption |
|---|---|---|
| China 🇨🇳 | 82.3 | 54.3% |
| India 🇮🇳 | 17.5 | 11.6% |
| United States 🇺🇸 | 9.2 | 6.1% |
| Japan 🇯🇵 | 4.6 | 3.0% |
| South Africa 🇿🇦 | 3.5 | 2.3% |
| Russia 🇷🇺 | 3.3 | 2.2% |
| Indonesia 🇮🇩 | 3.3 | 2.2% |
| South Korea 🇰🇷 | 3.0 | 2.0% |
| Vietnam 🇻🇳 | 2.1 | 1.4% |
| Germany 🇩🇪 | 1.8 | 1.2% |
Together, China and India account for 66% of global coal consumption and emit about 35% of the world’s greenhouse gasses (GHG). If you add the United States to the mix, this goes up to 72% of coal consumption and 49% of GHGs.
How Urgent is to Phase Out Coal?
According to the United Nations, emissions from current and planned fossil energy infrastructure are already more than twice the amount that would push the planet over 1.5°C of global heating, a level that scientists say could bring more intense heat, fire, storms, flooding, and drought than the present 1.2°C.
Apart from being the largest source of CO2 emissions, coal combustion is also a major threat to public health because of the fine particulate matter released into the air.
As just one example of this impact, a recent study from Harvard University estimates air pollution from fossil fuel combustion is responsible for 1 in 5 deaths globally.
The Move to Renewables
Coal-powered electricity generation must fall by 13% every year until 2030 to achieve the Paris Agreement’s goals of keeping global heating to only 1.5 degrees.
To reach the mark, countries would need to speed up the shift from their current carbon-intensive pathways to renewable energy sources like wind and solar.
How fast the transition away from coal will be achieved depends on a complicated balance between carbon emissions cuts and maintaining economic growth, the latter of which is still largely dependent on coal power.


Energy Shift
Visualizing Copper Production by Country in 2023
Chile and Peru account for one-third of the world’s copper output.

Visualizing Copper Production by Country in 2023
This was originally posted on our Voronoi app. Download the app for free on iOS or Android and discover incredible data-driven charts from a variety of trusted sources.
Copper is considered an essential metal for the clean energy transition because it is a great conductor of electricity.
As a result, governments around the world have been encouraging the construction of new mines, and mining companies have been seeking new projects and acquiring existing mines to meet the growing demand.
In this graphic, we illustrate global copper production in 2023, based on data from the U.S. Geological Survey, Mineral Commodity Summaries, as of January 2024.
Most Copper Comes from South America
Chile and Peru account for one-third of the world’s copper output.
| Country | Region | 2023E Production (Million tonnes) |
|---|---|---|
| 🇨🇱 Chile | South America | 5.0 |
| 🇵🇪 Peru | South America | 2.6 |
| 🇨🇩 Congo (Kinshasa) | Africa | 2.5 |
| 🇨🇳 China | Asia | 1.7 |
| 🇺🇸 United States | North America | 1.1 |
| 🇷🇺 Russia | Europe/Asia | 0.9 |
| 🇦🇺 Australia | Oceania | 0.8 |
| 🇮🇩 Indonesia | Asia | 0.8 |
| 🇿🇲 Zambia | Africa | 0.8 |
| 🇲🇽 Mexico | North America | 0.7 |
| 🇰🇿 Kazakhstan | Asia | 0.6 |
| 🇨🇦 Canada | North America | 0.5 |
| 🇵🇱 Poland | Europe | 0.4 |
| 🌍 Rest of World | -- | 3.1 |
| World total (rounded) | -- | 21.5 |
Chile is also home to the two largest mines in the world, Escondida and Collahuasi.
Meanwhile, African countries have rapidly increased their production. The Democratic Republic of Congo, for example, transitioned from being a secondary copper producer in the late 1990s to becoming the third-largest producer by 2023.
Part of the growth in copper mining in Africa is attributed to high investment from China. Chinese mining companies represent 8% of Africa’s total output in the mining sector.
Within its territory, China has also seen a 277% growth in copper production over the last three decades.
In the U.S., Arizona is the leading copper-producing state, accounting for approximately 70% of domestic output. Copper is also mined in Michigan, Missouri, Montana, Nevada, New Mexico, and Utah.
Energy Shift
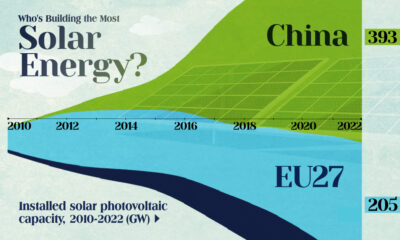
Who’s Building the Most Solar Energy?
China’s solar capacity triples USA, nearly doubles EU.

Who’s Building the Most Solar Energy?
This was originally posted on our Voronoi app. Download the app for free on iOS or Android and discover incredible data-driven charts from a variety of trusted sources.
In 2023, solar energy accounted for three-quarters of renewable capacity additions worldwide. Most of this growth occurred in Asia, the EU, and the U.S., continuing a trend observed over the past decade.
In this graphic, we illustrate the rise in installed solar photovoltaic (PV) capacity in China, the EU, and the U.S. between 2010 and 2022, measured in gigawatts (GW). Bruegel compiled the data..
Chinese Dominance
As of 2022, China’s total installed capacity stands at 393 GW, nearly double that of the EU’s 205 GW and surpassing the USA’s total of 113 GW by more than threefold in absolute terms.
| Installed solar capacity (GW) | China | EU27 | U.S. |
|---|---|---|---|
| 2022 | 393.0 | 205.5 | 113.0 |
| 2021 | 307.0 | 162.7 | 95.4 |
| 2020 | 254.0 | 136.9 | 76.4 |
| 2019 | 205.0 | 120.1 | 61.6 |
| 2018 | 175.3 | 104.0 | 52.0 |
| 2017 | 130.8 | 96.2 | 43.8 |
| 2016 | 77.8 | 91.5 | 35.4 |
| 2015 | 43.6 | 87.7 | 24.2 |
| 2014 | 28.4 | 83.6 | 18.1 |
| 2013 | 17.8 | 79.7 | 13.3 |
| 2012 | 6.7 | 71.1 | 8.6 |
| 2011 | 3.1 | 53.3 | 5.6 |
| 2010 | 1.0 | 30.6 | 3.4 |
Since 2017, China has shown a compound annual growth rate (CAGR) of approximately 25% in installed PV capacity, while the USA has seen a CAGR of 21%, and the EU of 16%.
Additionally, China dominates the production of solar power components, currently controlling around 80% of the world’s solar panel supply chain.
In 2022, China’s solar industry employed 2.76 million individuals, with manufacturing roles representing approximately 1.8 million and the remaining 918,000 jobs in construction, installation, and operations and maintenance.
The EU industry employed 648,000 individuals, while the U.S. reached 264,000 jobs.
According to the IEA, China accounts for almost 60% of new renewable capacity expected to become operational globally by 2028.
Despite the phasing out of national subsidies in 2020 and 2021, deployment of solar PV in China is accelerating. The country is expected to reach its national 2030 target for wind and solar PV installations in 2024, six years ahead of schedule.

-

 Electrification3 years ago
Ranked: The Top 10 EV Battery Manufacturers
-

 Electrification2 years ago
The Key Minerals in an EV Battery
-

 Real Assets3 years ago
The World’s Top 10 Gold Mining Companies
-

 Electrification2 years ago
Mapped: Solar Power by Country in 2021
-

 Misc3 years ago
All the Metals We Mined in One Visualization
-

 Energy Shift2 years ago
What Are the Five Major Types of Renewable Energy?
-

 Electrification2 years ago
The World’s Largest Nickel Mining Companies
-

 Misc3 years ago
The Largest Copper Mines in the World by Capacity