Used Vehicle Value Index
Quarterly Conference Call
The next quarterly Manheim Used Vehicle Value Index (MUVVI) conference call is scheduled for Tuesday, Jul 9 at 11am ET.
Join Cox Automotive Chief Economist Jonathan Smoke, Jeremy Robb, senior director of Economic and Industry Insights, and Scott Vanner, Economic and Industry Insights analyst, as they discuss the latest Manheim Used Vehicle Value Index and the major economic and industry trends that shaped the quarter.
All questions related to the Manheim Used Vehicle Value Index and wholesale market can be sent to manheim.data@coxautoinc.com.
Listen to a recording of the last call.
View the Most Recent Presentation
The presentation will be available one hour before the conference call.
View Previous Presentations
By applying statistical analysis to its database of more than 5 million used vehicle transactions annually, Manheim has developed a measurement of used vehicle prices that is independent of underlying shifts in the characteristics of vehicles being sold. View the index methodology.
The Manheim Index is increasingly recognized by both financial and economic analysts as the premier indicator of pricing trends in the used vehicle market, but should not be considered indicative or predictive of any individual remarketer’s results.
Wholesale Used-Vehicle Prices Declined in April
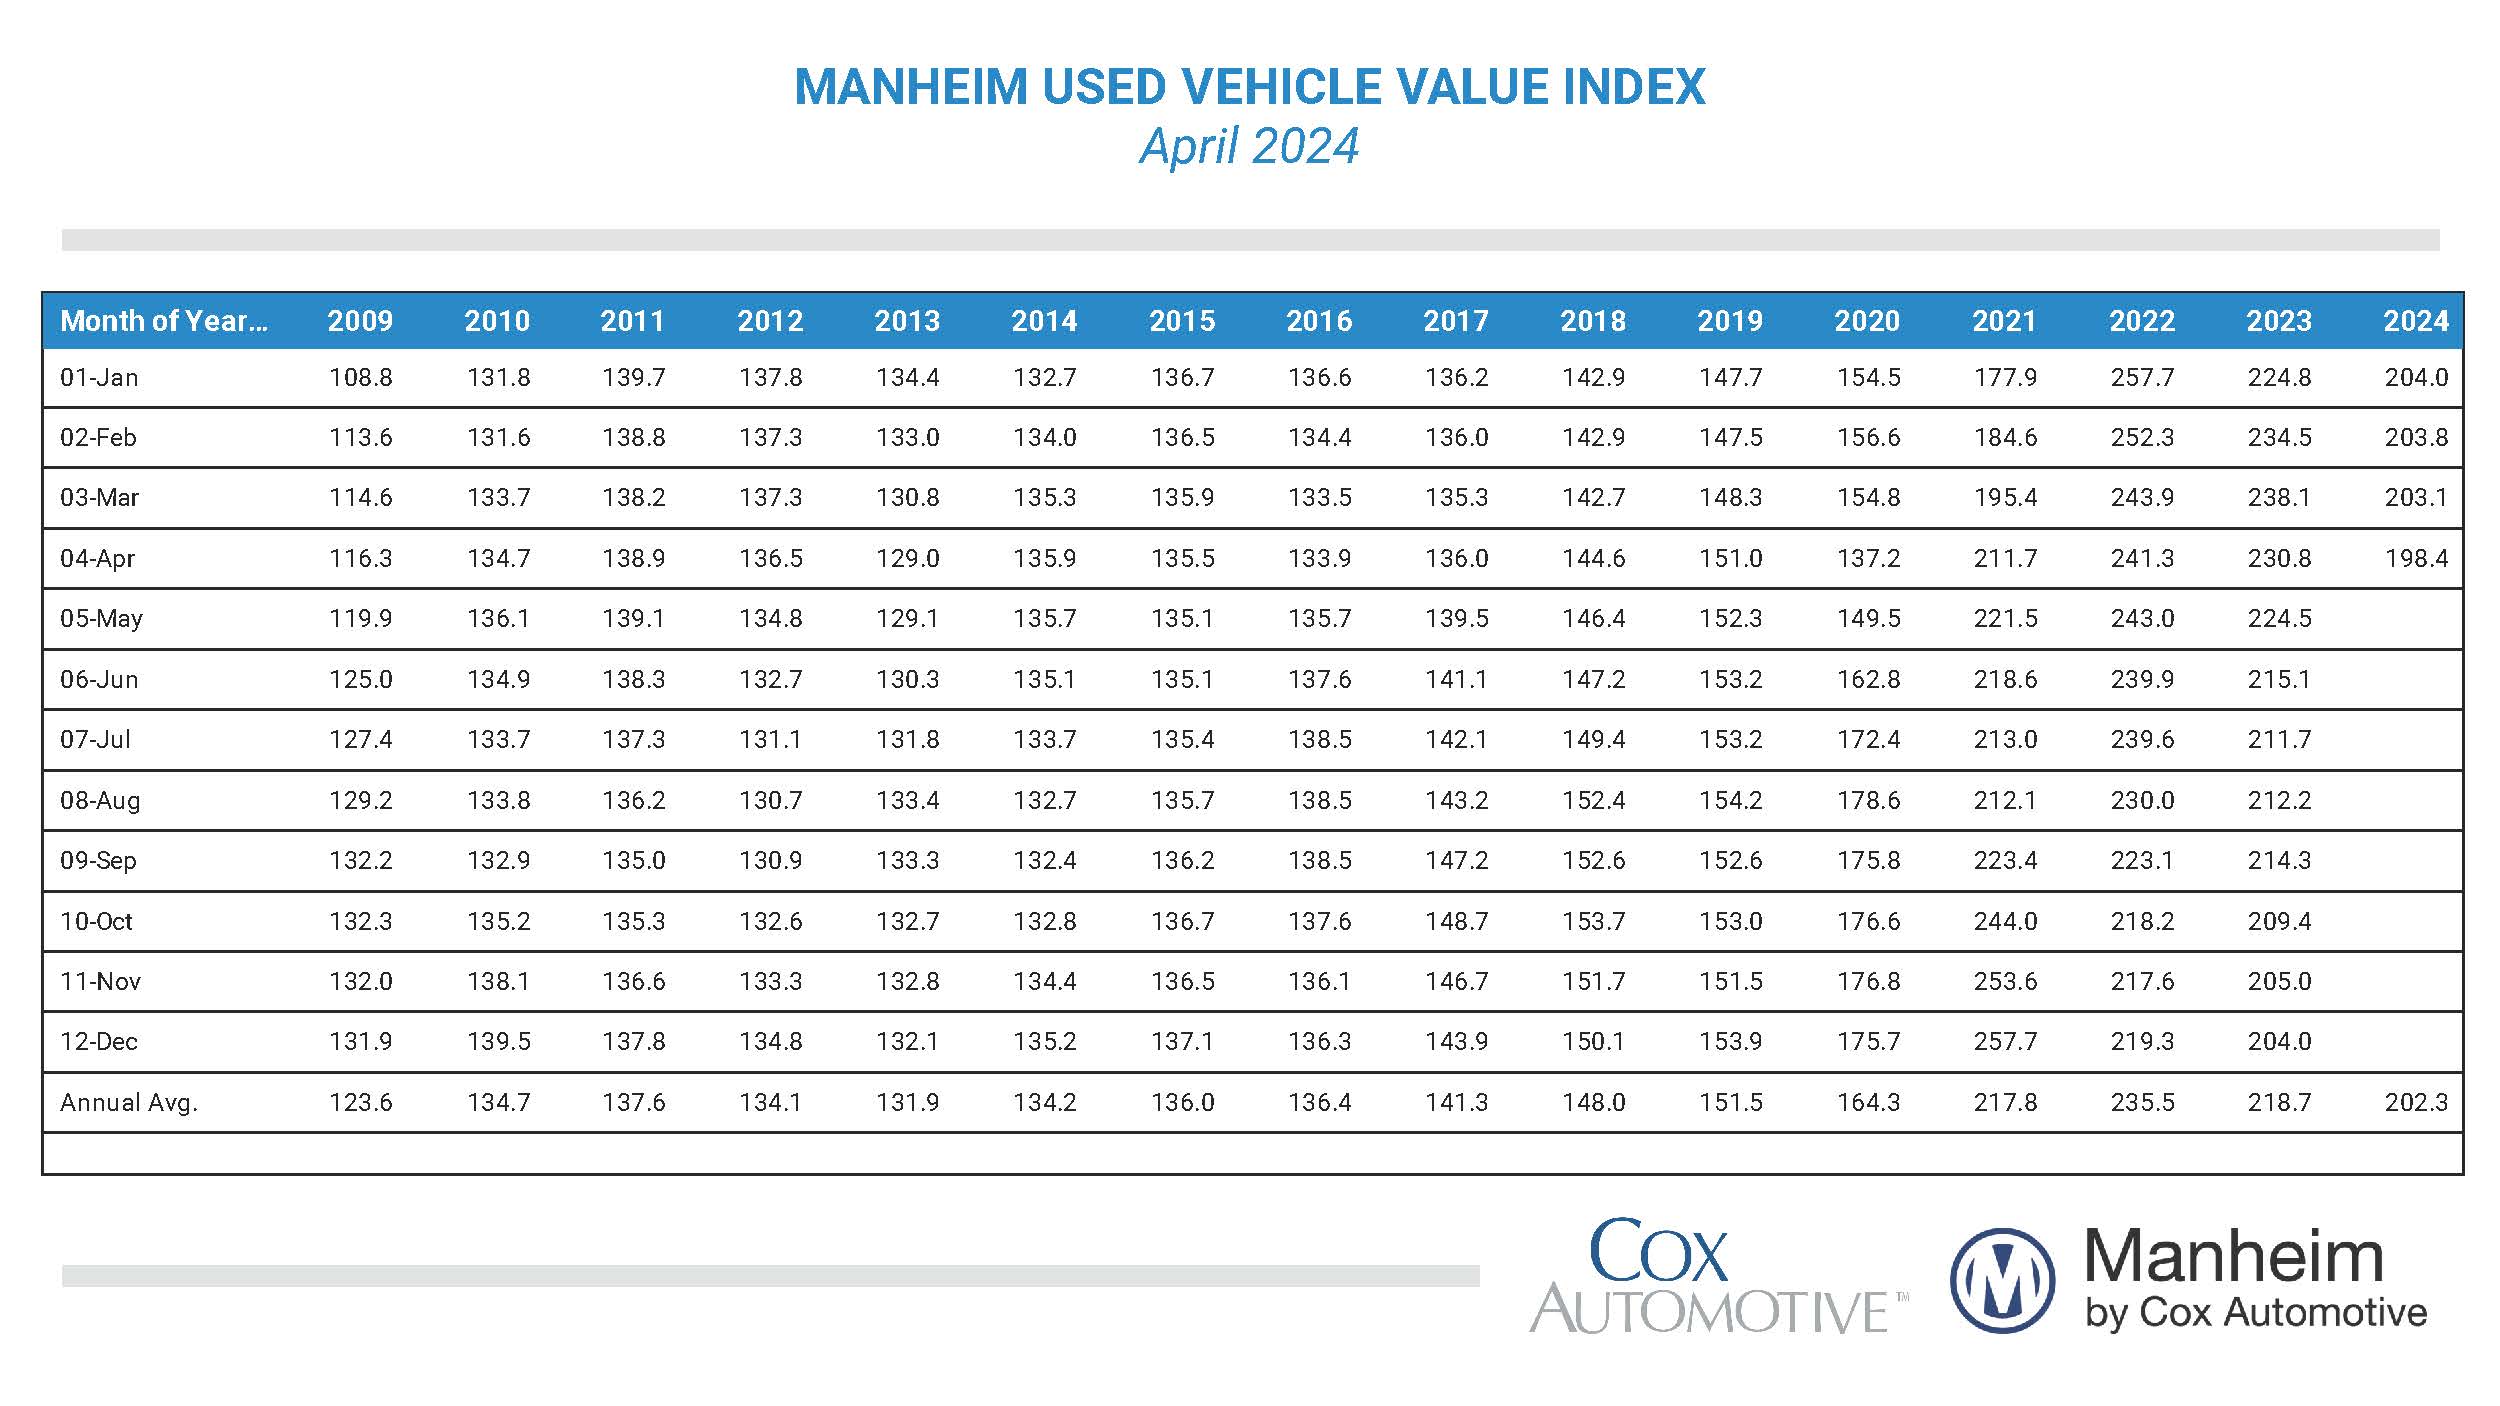
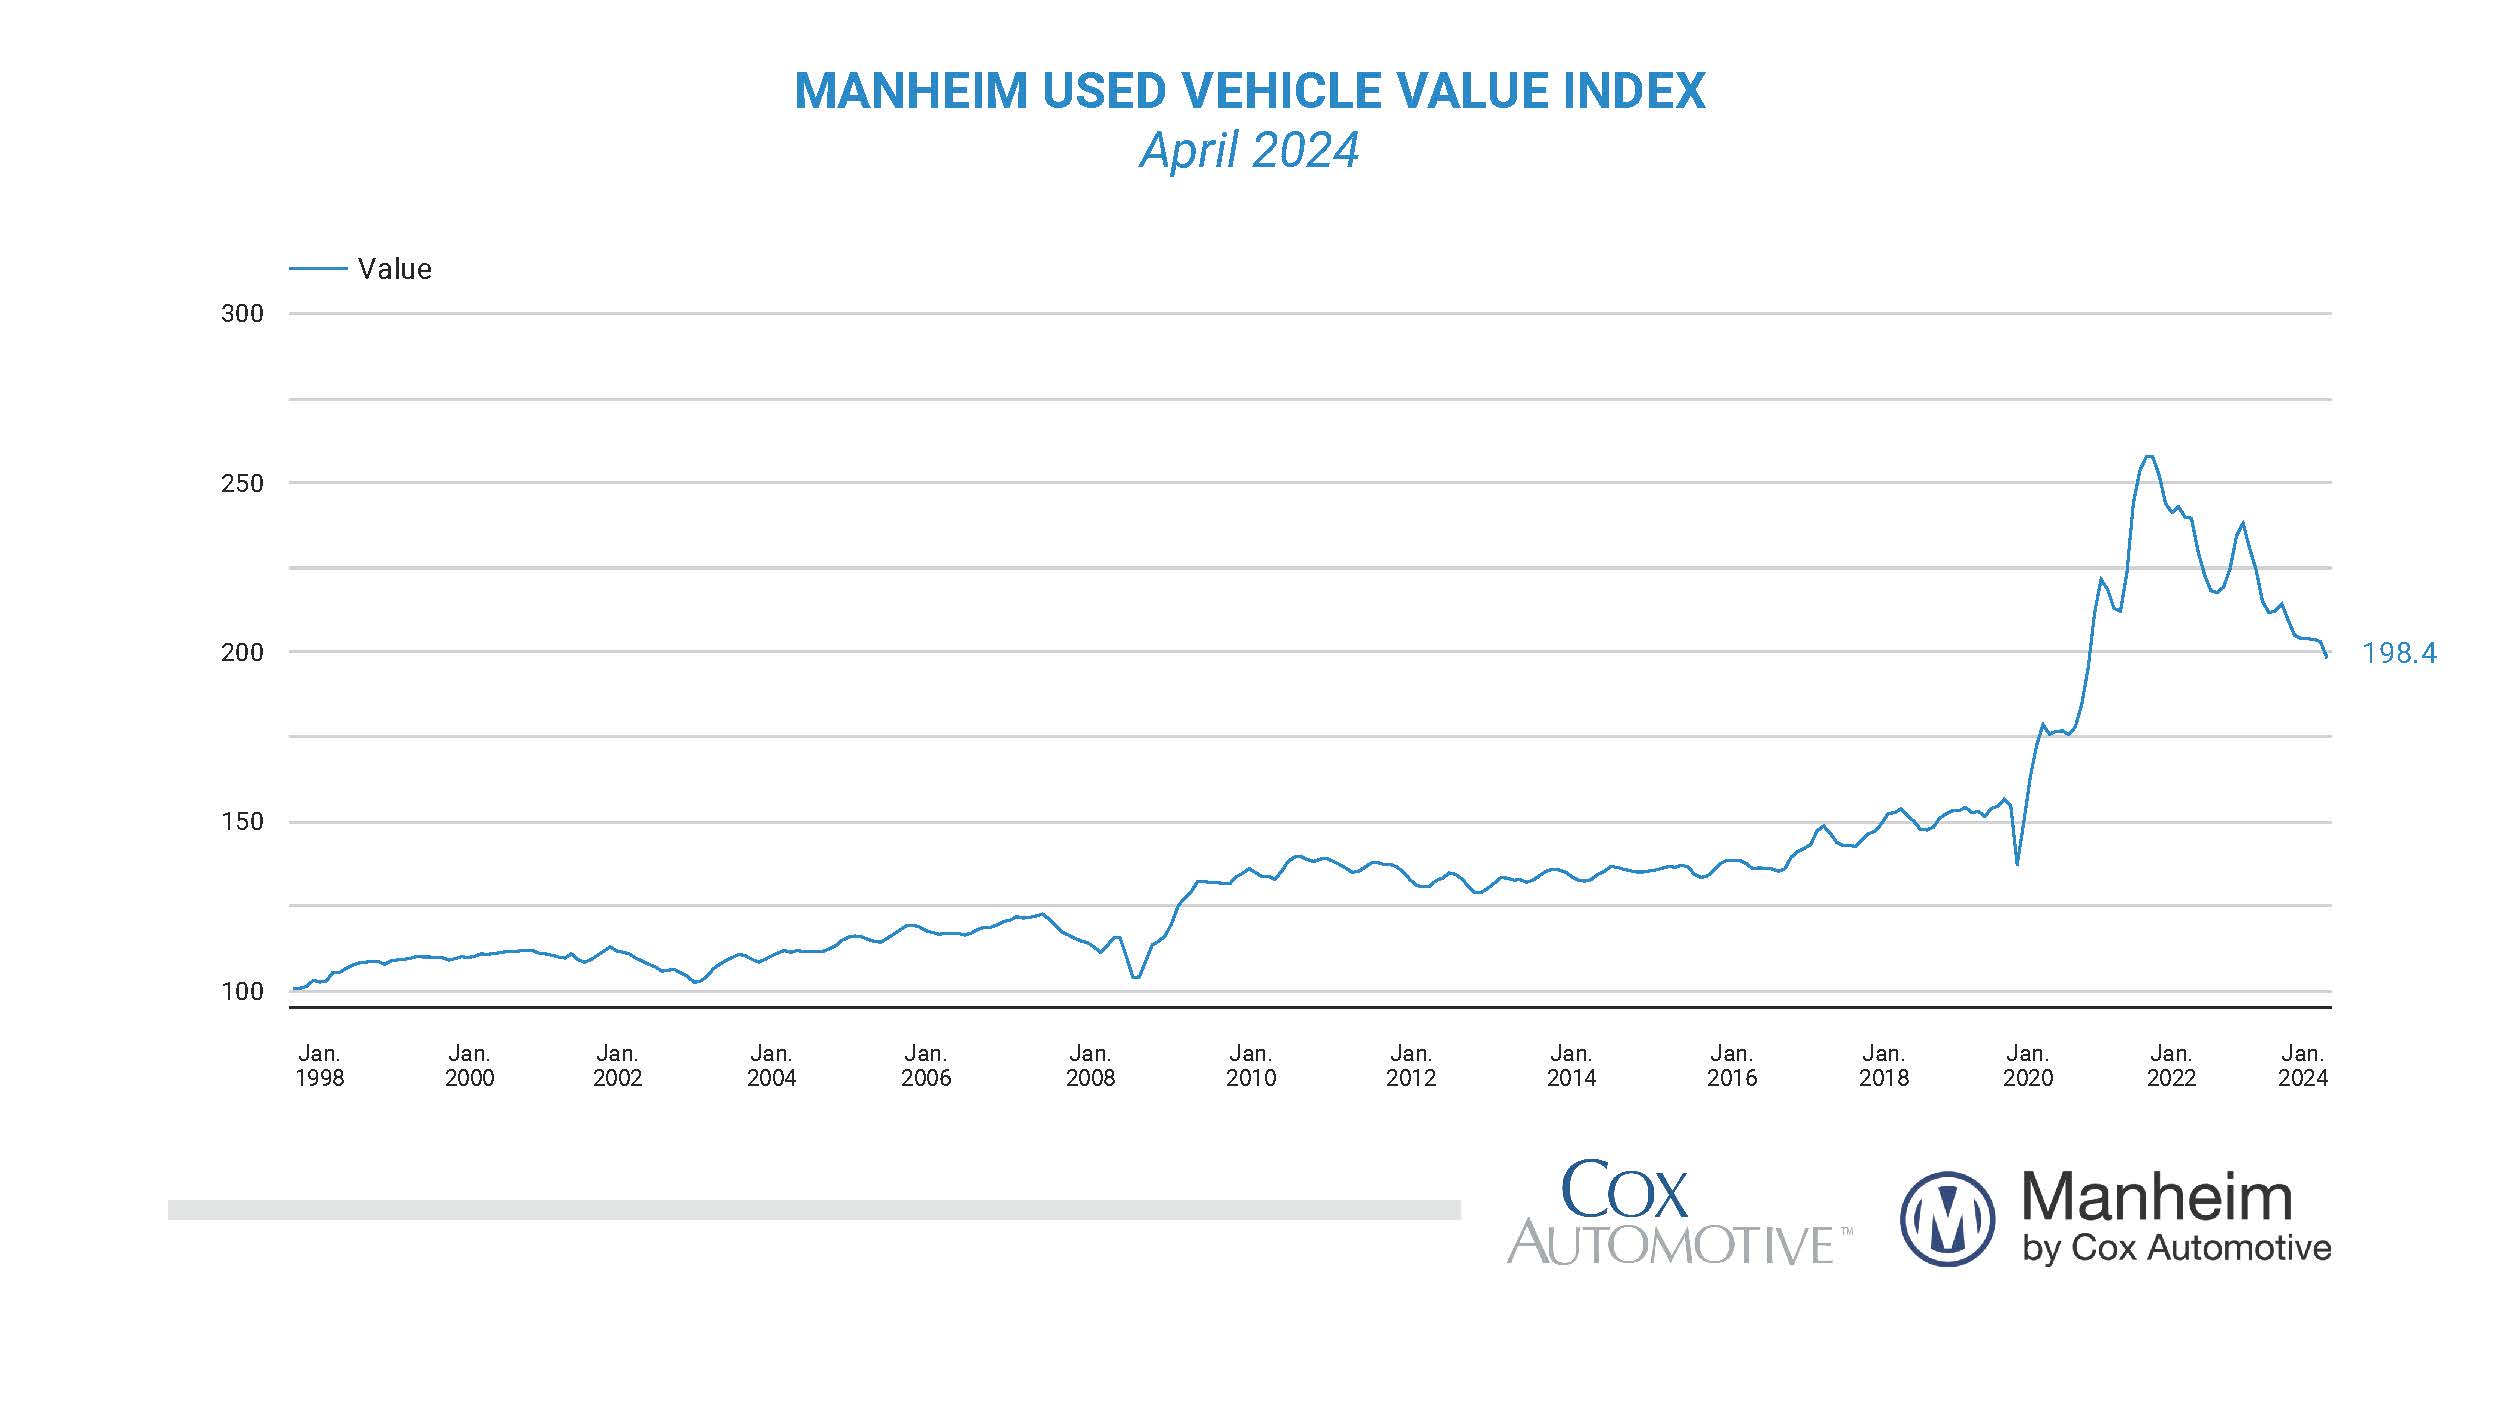
Wholesale used-vehicle prices (on a mix, mileage, and seasonally adjusted basis) were down in April compared to March. The Manheim Used Vehicle Value Index (MUVVI) fell to 198.4, a decline of 14.0% from a year ago. The seasonal adjustment to the index magnified the results for the month, resulting in a 2.3% month-over-month decrease. The non-adjusted price in April decreased by 0.6% compared to March, moving the unadjusted average price down 11.9% year over year.
In April, Manheim Market Report (MMR) values saw weekly decreases that were slightly above long-term averages during each week of the month. Over the last four weeks, the Three-Year-Old Index decreased an aggregate of 1.6%, including a decline of 0.5% in the last week of the month. Those same five weeks delivered an average decrease of 1.0% between 2014 and 2019, illustrating that depreciation trends are currently tracking higher than long-term averages for the year.
Over the month of April, daily MMR Retention, which is the average difference in price relative to the current MMR, averaged 98.3%, meaning market prices fell below MMR values and declined against March as well, which was 99.4%. The average daily sales conversion rate dropped to 59.6%, showing that demand declined relative to March, which is seasonally normal for this time of year. For comparison, the daily sales conversion rate averaged 60.4% in April during the last three years.

The major market segments all experienced seasonally adjusted prices that were down year over year in April. Compared to April 2023, luxury was the only segment that lost less than the industry, down just 12.9%, and SUVs were down a little more than the market, falling by 14.6% year over year. The worst-performing segment was compact cars, down 17.6% against last year, followed by midsize cars, off by 16.8%, with pickups down 15.2%. Compared to last month, the pickup segment fell by just 1.3%, less than the market’s decline of 2.3% for the month. Compact cars fell the most against March, declining by 3.9%, luxury was down 3.2%, SUVs decreased by 3.1%, and midsize cars were down 3.0%.
With the increase in interest in electric vehicle (EV) values versus the non-EV market, we are working on sharing metrics for those segments. Seasonally adjusted EV values for April 2024 were down 17.5%, while non-EVs were down 13.1% year over year. Regarding values against last month, seasonally adjusted EV values declined in line with the market, falling by 2.6% from March 2024, while non-EVs declined 3.0% over the same period.
Retail used-vehicle sales decreased in April. Assessing retail vehicle sales based on observed changes in units tracked by vAuto, we initially estimate that retail used-vehicle sales in April were down 4% compared to March but higher year over year by 9%. The average retail listing price for a used vehicle was up 2% over the last four weeks.
Using estimates of retail used days’ supply based on vAuto data, an initial assessment indicates April ended at 45 days’ supply, up two days from 43 days at the end of March but down one day from April 2023 at 46 days.
April’s total new-light-vehicle sales were down 3.3% from last year, and volume was down 9.1% from March. The April sales pace, or seasonally adjusted annual rate (SAAR), came in at 15.7 million, up just 0.4% from last year and up slightly from March’s 15.6 million level.
Combined sales into large rental, commercial, and government fleets declined 5.6% year over year in April. Including an estimate for fleet deliveries into dealer and manufacturer channels, the remaining retail sales were estimated to be down 1.2% from last year, leading to an estimated retail SAAR of 12.9 million, up 0.2 million from last year’s pace, and up from March’s 12.8 million level. Fleet market share was estimated to be 17.5%, down from last year’s 19.3% share.
Rental risk prices mixed; mileage declines slowed in April. The average price for rental risk units sold at auction in April declined 12.2% year over year. Rental risk prices increased by just 0.2% compared to March. Average mileage for rental risk units in April (at 58,800 miles) continues to be down compared to a year ago but much less than recent periods, declining by only 1.3% against April 2023. Mileage for units in April was up 12.1% from March.
All measures of consumer confidence saw declines in April. The Conference Board Consumer Confidence Index® declined 5.9% in April, as views of both the present situation and the future declined. As a result of the decline, consumer confidence was down 6.5% year over year. Plans to purchase a vehicle in the next six months declined but remained higher year over year. According to the sentiment index from the University of Michigan, consumer sentiment declined 2.8% in April but was up 21.2% year over year. The median consumer expectation for inflation in a year jumped to 3.2%, its highest level since November, and the expectation for five years increased to 3.0%, which was also the highest since November. The consumer’s view of buying conditions for vehicles declined to the lowest level since December as views of both interest rates and prices deteriorated. The daily index of consumer sentiment from Morning Consult was very volatile in April and ended up declining by 1.6% for the month, leaving the index up by 7.3% year over year. Gas prices increased in April. The national average price for unleaded gas from AAA increased 3.6% from the end of March to $3.66 per gallon, which was up 2% year over year.