Economy
Interactive: Comparing Military Spend Around the World
Article/Editing:
var divElement = document.getElementById(‘viz1680503059482’); var vizElement = divElement.getElementsByTagName(‘object’)[0]; vizElement.style.width=’1200px’;vizElement.style.height=’927px’; var scriptElement = document.createElement(‘script’); scriptElement.src = ‘https://public.tableau.com/javascripts/api/viz_v1.js’; vizElement.parentNode.insertBefore(scriptElement, vizElement);
Open the large interactive version here
Open the large interactive version here
Comparing Military Spend Around the World
One of the easiest ways to identify a nation’s priorities is by tracking its expenditures, and military spend is no different.
Usually spending is measured, and ranked, in absolute amounts. For example, countries around the world collectively spent $2.1 trillion on their militaries in 2021, with the most coming from the U.S. ($800 billion), China ($293 billion), and India ($77 billion).
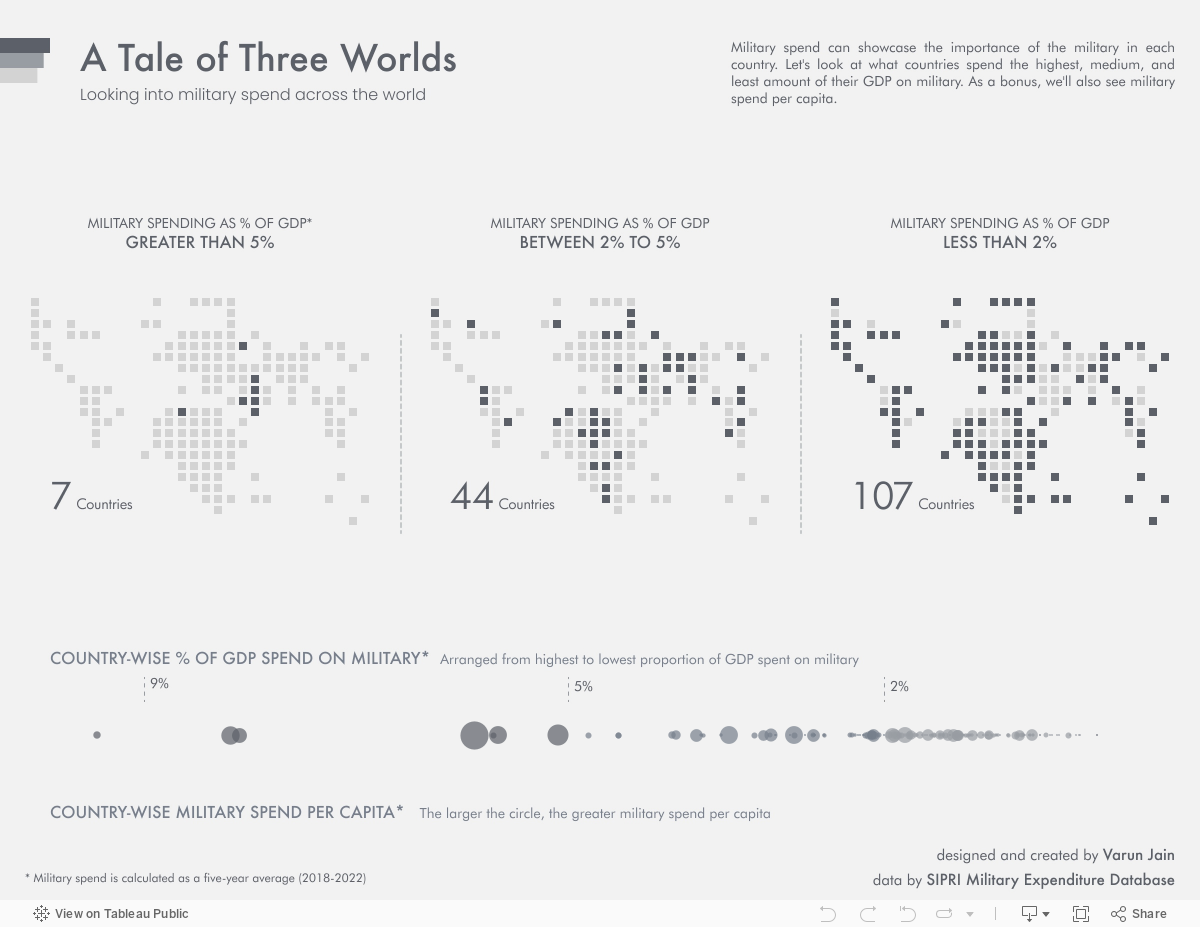
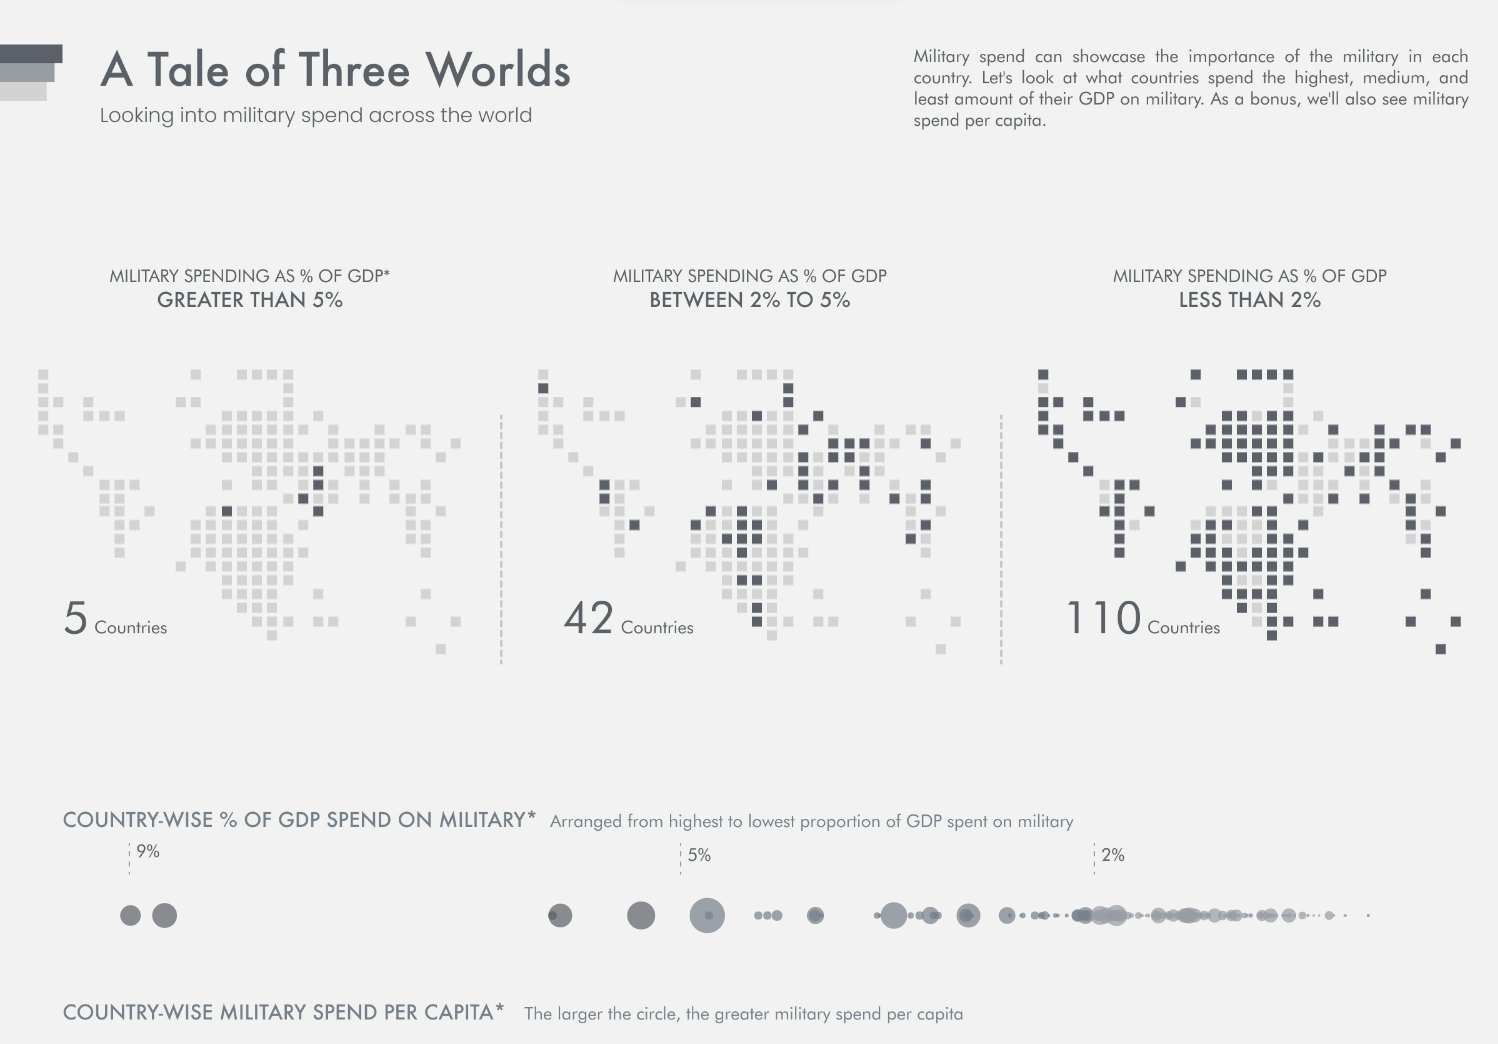
But these eye-popping figures are best understood in the context of each country’s economy. Using data from the Stockholm International Peace Research Institute (SIPRI), Varun Jain has visualized 158 countries’ military expenditures, both as a percentage of their total GDP as well as in average per-capita spend.
Countries’ Military Spend as a Percentage of their Economy
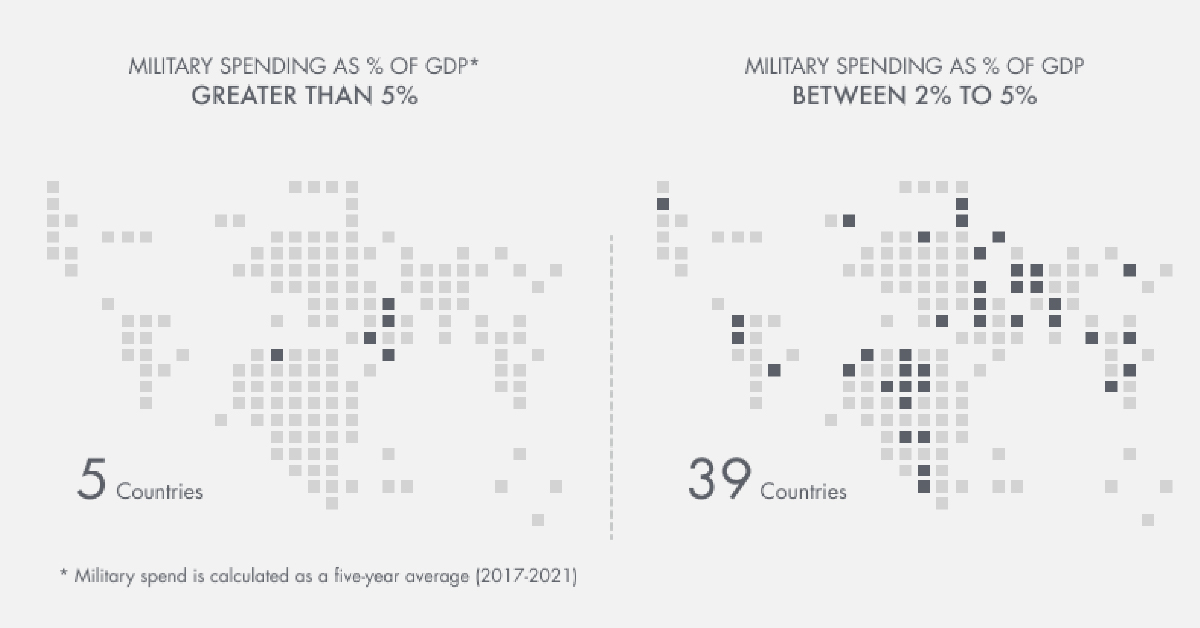
To begin, Jain identified three categories of military expenditure as a percent of GDP, using the five-year (2018‒2022) average for more consistent data:
| Military Spend | % of GDP | Countries |
|---|---|---|
| High | Above 5% | 7 |
| Medium | 2‒5% | 44 |
| Low | Below 2% | 107 |
Under this categorization, the stand outs are the countries spending an outsized amount of their economic output on military, rather than the highest total spenders in absolute terms.
At the top of the table is Ukraine, which has earmarked a staggering average of 9.46% of its total economic output on defense over the past five years. That’s well ahead of second-place Saudi Arabia, which is slightly above 8%.
In Ukraine’s case, its high ranking shows how quickly priorities can change. From 2018 to 2021, the country spent 3.2-3.8% of its GDP on its military, but the outbreak of war with Russia saw its expenditures jump to one-third of economic output.
Other countries from the Middle East and North Africa follow in this tier, with Oman third at 8.11% and Qatar fourth with 5.88%. Rounding out the top seven high spenders are Algeria, Kuwait, and Israel.
| Rank | Country | Military Spend | % of GDP |
|---|---|---|---|
| 1 | 🇺🇦 Ukraine | High | 9.46% |
| 2 | 🇸🇦 Saudi Arabia | High | 8.19% |
| 3 | 🇴🇲 Oman | High | 8.11% |
| 4 | 🇶🇦 Qatar | High | 5.88% |
| 5 | 🇩🇿 Algeria | High | 5.70% |
| 6 | 🇰🇼 Kuwait | High | 5.66% |
| 7 | 🇮🇱 Israel | High | 5.09% |
| 8 | 🇯🇴 Jordan | Medium | 4.81% |
| 9 | 🇦🇲 Armenia | Medium | 4.53% |
| 10 | 🇦🇿 Azerbaijan | Medium | 4.53% |
| 11 | 🇱🇧 Lebanon | Medium | 4.01% |
| 12 | 🇷🇺 Russia | Medium | 3.98% |
| 13 | 🇧🇭 Bahrain | Medium | 3.79% |
| 14 | 🇵🇰 Pakistan | Medium | 3.75% |
| 15 | 🇲🇦 Morocco | Medium | 3.72% |
| 16 | 🇺🇿 Uzbekistan | Medium | 3.56% |
| 17 | 🇺🇸 U.S. | Medium | 3.48% |
| 18 | 🇨🇴 Colombia | Medium | 3.24% |
| 19 | 🇬🇷 Greece | Medium | 3.15% |
| 20 | 🇳🇦 Namibia | Medium | 3.09% |
| 21 | 🇧🇳 Brunei | Medium | 3.09% |
| 22 | 🇸🇸 South Sudan | Medium | 3.05% |
| 23 | 🇹🇬 Togo | Medium | 3.03% |
| 24 | 🇲🇱 Mali | Medium | 2.90% |
| 25 | 🇨🇺 Cuba | Medium | 2.88% |
| 26 | 🇸🇬 Singapore | Medium | 2.86% |
| 27 | 🇧🇼 Botswana | Medium | 2.86% |
| 28 | 🇲🇲 Myanmar | Medium | 2.76% |
| 29 | 🇧🇫 Burkina Faso | Medium | 2.70% |
| 30 | 🇮🇶 Iraq | Medium | 2.69% |
| 31 | 🇰🇷 South Korea | Medium | 2.69% |
| 32 | 🇨🇬 Republic of Congo | Medium | 2.68% |
| 33 | 🇹🇩 Chad | Medium | 2.66% |
| 34 | 🇮🇳 India | Medium | 2.58% |
| 35 | 🇹🇳 Tunisia | Medium | 2.58% |
| 36 | 🇪🇨 Ecuador | Medium | 2.34% |
| 37 | 🇮🇷 Iran | Medium | 2.32% |
| 38 | 🇻🇳 Viet Nam | Medium | 2.28% |
| 39 | 🇰🇭 Cambodia | Medium | 2.26% |
| 40 | 🇲🇷 Mauritania | Medium | 2.24% |
| 41 | 🇳🇪 Niger | Medium | 2.21% |
| 42 | 🇧🇮 Burundi | Medium | 2.21% |
| 43 | 🇹🇷 Turkey | Medium | 2.19% |
| 44 | 🇵🇱 Poland | Medium | 2.17% |
| 45 | 🇱🇻 Latvia | Medium | 2.14% |
| 46 | 🇱🇹 Lithuania | Medium | 2.13% |
| 47 | 🇪🇪 Estonia | Medium | 2.13% |
| 48 | 🇬🇧 United Kingdom | Medium | 2.12% |
| 49 | 🇺🇾 Uruguay | Medium | 2.11% |
| 50 | 🇷🇸 Serbia | Medium | 2.06% |
| 51 | 🇺🇬 Uganda | Medium | 2.02% |
| 52 | 🇭🇷 Croatia | Low | 1.97% |
| 53 | 🇦🇺 Australia | Low | 1.93% |
| 54 | 🇨🇱 Chile | Low | 1.92% |
| 55 | 🇫🇷 France | Low | 1.91% |
| 56 | 🇨🇾 Cyprus | Low | 1.90% |
| 57 | 🇷🇴 Romania | Low | 1.87% |
| 58 | 🇧🇬 Bulgaria | Low | 1.85% |
| 59 | 🇸🇿 Eswatini | Low | 1.82% |
| 60 | 🇳🇴 Norway | Low | 1.81% |
| 61 | 🇨🇫 Central African Republic | Low | 1.78% |
| 62 | 🇱🇰 Sri Lanka | Low | 1.77% |
| 63 | 🇵🇹 Portugal | Low | 1.77% |
| 64 | 🇹🇼 Taiwan | Low | 1.76% |
| 65 | 🇨🇳 China | Low | 1.72% |
| 66 | 🇬🇪 Georgia | Low | 1.71% |
| 67 | 🇸🇰 Slovakia | Low | 1.67% |
| 68 | 🇬🇼 Guinea-Bissau | Low | 1.65% |
| 69 | 🇰🇬 Kyrgyzstan | Low | 1.62% |
| 70 | 🇬🇳 Guinea | Low | 1.61% |
| 71 | 🇫🇮 Finland | Low | 1.60% |
| 72 | 🇸🇳 Senegal | Low | 1.58% |
| 73 | 🇭🇳 Honduras | Low | 1.56% |
| 74 | 🇬🇦 Gabon | Low | 1.56% |
| 75 | 🇲🇿 Mozambique | Low | 1.56% |
| 76 | 🇱🇸 Lesotho | Low | 1.56% |
| 77 | 🇲🇪 Montenegro | Low | 1.54% |
| 78 | 🇫🇯 Fiji | Low | 1.54% |
| 79 | 🇯🇲 Jamaica | Low | 1.49% |
| 80 | 🇦🇴 Angola | Low | 1.48% |
| 81 | 🇮🇹 Italy | Low | 1.48% |
| 82 | 🇭🇺 Hungary | Low | 1.48% |
| 83 | 🇧🇴 Bolivia | Low | 1.46% |
| 84 | 🇸🇨 Seychelles | Low | 1.43% |
| 85 | 🇳🇱 Netherlands | Low | 1.41% |
| 86 | 🇸🇩 Sudan | Low | 1.39% |
| 87 | 🇷🇼 Rwanda | Low | 1.39% |
| 88 | 🇳🇵 Nepal | Low | 1.36% |
| 89 | 🇩🇰 Denmark | Low | 1.36% |
| 90 | 🇦🇱 Albania | Low | 1.34% |
| 91 | 🇪🇸 Spain | Low | 1.34% |
| 92 | 🇹🇭 Thailand | Low | 1.33% |
| 93 | 🇦🇫 Afghanistan | Low | 1.33% |
| 94 | 🇳🇿 New Zealand | Low | 1.32% |
| 95 | 🇨🇦 Canada | Low | 1.32% |
| 96 | 🇩🇪 Germany | Low | 1.31% |
| 97 | 🇲🇰 North Macedonia | Low | 1.30% |
| 98 | 🇧🇷 Brazil | Low | 1.29% |
| 99 | 🇧🇿 Belize | Low | 1.28% |
| 100 | 🇸🇻 El Salvador | Low | 1.28% |
| 101 | 🇧🇩 Bangladesh | Low | 1.26% |
| 102 | 🇿🇲 Zambia | Low | 1.25% |
| 103 | 🇬🇶 Equatorial Guinea | Low | 1.24% |
| 104 | 🇬🇾 Guyana | Low | 1.22% |
| 105 | 🇨🇮 Cote d'Ivoire | Low | 1.22% |
| 106 | 🇪🇬 Egypt | Low | 1.20% |
| 107 | 🇵🇪 Peru | Low | 1.20% |
| 108 | 🇧🇾 Belarus | Low | 1.18% |
| 109 | 🇸🇪 Sweden | Low | 1.17% |
| 110 | 🇰🇪 Kenya | Low | 1.13% |
| 111 | 🇸🇮 Slovenia | Low | 1.10% |
| 112 | 🇹🇱 Timor Leste | Low | 1.08% |
| 113 | 🇹🇿 Tanzania | Low | 1.05% |
| 114 | 🇨🇲 Cameroon | Low | 1.04% |
| 115 | 🇹🇯 Tajikistan | Low | 1.03% |
| 116 | 🇯🇵 Japan | Low | 1.03% |
| 117 | 🇧🇪 Belgium | Low | 1.02% |
| 118 | 🇱🇷 Liberia | Low | 1.00% |
| 119 | 🇲🇾 Malaysia | Low | 0.98% |
| 120 | 🇵🇭 Philippines | Low | 0.96% |
| 121 | 🇵🇾 Paraguay | Low | 0.95% |
| 122 | 🇽🇰 Kosovo | Low | 0.95% |
| 123 | 🇿🇦 South Africa | Low | 0.94% |
| 124 | 🇲🇼 Malawi | Low | 0.92% |
| 125 | 🇧🇦 Bosnia and Herzegovina | Low | 0.84% |
| 126 | 🇰🇿 Kazakhstan | Low | 0.83% |
| 127 | 🇦🇹 Austria | Low | 0.78% |
| 128 | 🇬🇲 Gambia | Low | 0.76% |
| 129 | 🇹🇹 Trinidad & Tobago | Low | 0.75% |
| 130 | 🇮🇩 Indonesia | Low | 0.74% |
| 131 | 🇨🇭 Switzerland | Low | 0.73% |
| 132 | 🇨🇿 Czech Republic | Low | 0.71% |
| 133 | 🇩🇴 Dominican Republic | Low | 0.70% |
| 134 | 🇲🇳 Mongolia | Low | 0.69% |
| 135 | 🇲🇬 Madagascar | Low | 0.68% |
| 136 | 🇨🇩 Dem. Rep. of Congo | Low | 0.64% |
| 137 | 🇳🇬 Nigeria | Low | 0.64% |
| 138 | 🇪🇹 Ethiopia | Low | 0.64% |
| 139 | 🇸🇱 Sierra Leone | Low | 0.64% |
| 140 | 🇦🇷 Argentina | Low | 0.63% |
| 141 | 🇱🇺 Luxembourg | Low | 0.61% |
| 142 | 🇲🇽 Mexico | Low | 0.61% |
| 143 | 🇳🇮 Nicaragua | Low | 0.60% |
| 144 | 🇨🇻 Cape Verde | Low | 0.54% |
| 145 | 🇧🇯 Benin | Low | 0.54% |
| 146 | 🇲🇹 Malta | Low | 0.48% |
| 147 | 🇬🇹 Guatemala | Low | 0.45% |
| 148 | 🇬🇭 Ghana | Low | 0.43% |
| 149 | 🇵🇬 Papua New Guinea | Low | 0.38% |
| 150 | 🇲🇩 Moldova | Low | 0.36% |
| 151 | 🇮🇪 Ireland | Low | 0.27% |
| 152 | 🇿🇼 Zimbabwe | Low | 0.26% |
| 153 | 🇻🇪 Venezuela | Low | 0.20% |
| 154 | 🇭🇹 Haiti | Low | 0.17% |
| 155 | 🇲🇺 Mauritius | Low | 0.16% |
| 156 | 🇨🇷 Costa Rica | Low | 0.00% |
| 157 | 🇮🇸 Iceland | Low | 0.00% |
| 158 | 🇵🇦 Panama | Low | 0.00% |
The medium group consists of 44 countries and is led by four nations (Jordan, Armenia, Azerbaijan, and Lebanon) that all spend more than 4% of their GDP on their militaries. Other familiar countries known to have large military budgets, like Russia, Pakistan, the U.S., India and the UK, are also in this category.
The low spend group has a total of 107 countries, but also contains some surprises. For example, China, France, and Germany—all in the top 10 countries by absolute military spend—actually have similar amounts of military spend as a percent of GDP as Georgia, Cyprus, and North Macedonia respectively.
At the bottom of the table are countries with either low military importance, or strange technicalities. For example, Mauritius is one of the countries with the lowest military budgets because it doesn’t officially have a standing military, instead relying on two paramilitary forces (a special mobile force and a Coast Guard).
Similarly, Iceland allocates 0% of its GDP towards military spending. In place of a standing army, the country maintains a specialized peacekeeping force, a substantial Coast Guard, and relies on security alliances within NATO, of which it is a member and provides financial support to.
Ranking Defense Spending Per Capita
While the measure above equalizes military spend on economic strength, per-capita military spending shows how much countries allocate while accounting for population size.
On a per-capita basis (again using a five-year average), Qatar leads the ranks with a per-capita spend of $4,564, well-ahead of Israel at $2,535, and Saudi Arabia at $1,928.
| Rank | Country | Per Capita Spend ($) |
|---|---|---|
| 1 | 🇶🇦 Qatar | $4,564 |
| 2 | 🇮🇱 Israel | $2,535 |
| 3 | 🇸🇦 Saudi Arabia | $1,928 |
| 4 | 🇸🇬 Singapore | $1,837 |
| 5 | 🇰🇼 Kuwait | $1,815 |
| 6 | 🇺🇸 U.S. | $1,815 |
| 7 | 🇳🇴 Norway | $1,438 |
| 8 | 🇴🇲 Oman | $1,254 |
| 9 | 🇦🇺 Australia | $1,131 |
| 10 | 🇧🇳 Brunei | $959 |
| 11 | 🇬🇧 UK | $913 |
| 12 | 🇰🇷 South Korea | $894 |
| 13 | 🇧🇭 Bahrain | $863 |
| 14 | 🇩🇰 Denmark | $861 |
| 15 | 🇫🇷 France | $811 |
| 16 | 🇫🇮 Finland | $801 |
| 17 | 🇳🇱 Netherlands | $765 |
| 18 | 🇱🇺 Luxembourg | $694 |
| 19 | 🇸🇪 Sweden | $662 |
| 20 | 🇨🇭 Switzerland | $647 |
| 21 | 🇨🇦 Canada | $645 |
| 22 | 🇬🇷 Greece | $629 |
| 23 | 🇩🇪 Germany | $623 |
| 24 | 🇳🇿 New Zealand | $610 |
| 25 | 🇪🇪 Estonia | $535 |
| 26 | 🇹🇼 Taiwan | $495 |
| 27 | 🇮🇹 Italy | $494 |
| 28 | 🇧🇪 Belgium | $487 |
| 29 | 🇷🇺 Russia | $467 |
| 30 | 🇱🇹 Lithuania | $463 |
| 31 | 🇵🇹 Portugal | $417 |
| 32 | 🇱🇻 Latvia | $405 |
| 33 | 🇨🇾 Cyprus | $399 |
| 34 | 🇯🇵 Japan | $398 |
| 35 | 🇪🇸 Spain | $395 |
| 36 | 🇦🇹 Austria | $393 |
| 37 | 🇵🇱 Poland | $359 |
| 38 | 🇺🇾 Uruguay | $354 |
| 39 | 🇸🇰 Slovakia | $334 |
| 40 | 🇱🇧 Lebanon | $334 |
| 41 | 🇸🇮 Slovenia | $302 |
| 42 | 🇺🇦 Ukraine | $302 |
| 43 | 🇭🇷 Croatia | $294 |
| 44 | 🇨🇱 Chile | $292 |
| 45 | 🇷🇴 Romania | $258 |
| 46 | 🇭🇺 Hungary | $248 |
| 47 | 🇮🇪 Ireland | $235 |
| 48 | 🇸🇨 Seychelles | $230 |
| 49 | 🇦🇿 Azerbaijan | $226 |
| 50 | 🇩🇿 Algeria | $219 |
| 51 | 🇦🇲 Armenia | $217 |
| 52 | 🇧🇼 Botswana | $215 |
| 53 | 🇯🇴 Jordan | $207 |
| 54 | 🇹🇷 Turkey | $199 |
| 55 | 🇨🇴 Colombia | $197 |
| 56 | 🇧🇬 Bulgaria | $194 |
| 57 | 🇨🇳 China | $183 |
| 58 | 🇲🇹 Malta | $175 |
| 59 | 🇨🇿 Czech Republic | $175 |
| 60 | 🇮🇷 Iran | $169 |
| 61 | 🇳🇦 Namibia | $159 |
| 62 | 🇮🇶 Iraq | $145 |
| 63 | 🇪🇨 Ecuador | $138 |
| 64 | 🇲🇪 Montenegro | $137 |
| 65 | 🇷🇸 Serbia | $133 |
| 66 | 🇹🇹 Trinidad & Tobago | $131 |
| 67 | 🇬🇦 Gabon | $124 |
| 68 | 🇲🇦 Morocco | $122 |
| 69 | 🇬🇶 Equatorial Guinea | $112 |
| 70 | 🇲🇾 Malaysia | $109 |
| 71 | 🇧🇷 Brazil | $107 |
| 72 | 🇹🇭 Thailand | $97 |
| 73 | 🇬🇾 Guyana | $92 |
| 74 | 🇹🇳 Tunisia | $91 |
| 75 | 🇫🇯 Fiji | $83 |
| 76 | 🇲🇰 North Macedonia | $83 |
| 77 | 🇰🇿 Kazakhstan | $82 |
| 78 | 🇵🇪 Peru | $81 |
| 79 | 🇬🇪 Georgia | $80 |
| 80 | 🇧🇾 Belarus | $80 |
| 81 | 🇯🇲 Jamaica | $77 |
| 82 | 🇦🇱 Albania | $76 |
| 83 | 🇸🇿 Eswatini | $72 |
| 84 | 🇱🇰 Sri Lanka | $69 |
| 85 | 🇦🇷 Argentina | $66 |
| 86 | 🇧🇿 Belize | $60 |
| 87 | 🇲🇽 Mexico | $59 |
| 88 | 🇩🇴 Dominican Republic | $58 |
| 89 | 🇻🇳 Viet Nam | $58 |
| 90 | 🇿🇦 South Africa | $56 |
| 91 | 🇸🇻 El Salvador | $54 |
| 92 | 🇧🇦 Bosnia and Herzegovina | $54 |
| 93 | 🇮🇳 India | $53 |
| 94 | 🇨🇬 Republic of Congo | $53 |
| 95 | 🇵🇾 Paraguay | $52 |
| 96 | 🇧🇴 Bolivia | $51 |
| 97 | 🇵🇰 Pakistan | $49 |
| 98 | 🇺🇿 Uzbekistan | $44 |
| 99 | 🇦🇴 Angola | $43 |
| 100 | 🇽🇰 Kosovo | $42 |
| 101 | 🇲🇷 Mauritania | $42 |
| 102 | 🇭🇳 Honduras | $42 |
| 103 | 🇪🇬 Egypt | $41 |
| 104 | 🇰🇭 Cambodia | $36 |
| 105 | 🇲🇲 Myanmar | $35 |
| 106 | 🇵🇭 Philippines | $33 |
| 107 | 🇲🇳 Mongolia | $33 |
| 108 | 🇮🇩 Indonesia | $31 |
| 109 | 🇧🇩 Bangladesh | $27 |
| 110 | 🇹🇱 Timor Leste | $27 |
| 111 | 🇲🇱 Mali | $26 |
| 112 | 🇸🇳 Senegal | $24 |
| 113 | 🇨🇮 Cote d'Ivoire | $23 |
| 114 | 🇹🇬 Togo | $21 |
| 115 | 🇰🇪 Kenya | $21 |
| 116 | 🇰🇬 Kyrgyzstan | $20 |
| 117 | 🇧🇫 Burkina Faso | $20 |
| 118 | 🇬🇳 Guinea | $19 |
| 119 | 🇱🇸 Lesotho | $19 |
| 120 | 🇨🇻 Cape Verde | $19 |
| 121 | 🇬🇹 Guatemala | $19 |
| 122 | 🇹🇩 Chad | $18 |
| 123 | 🇸🇸 South Sudan | $18 |
| 124 | 🇸🇩 Sudan | $18 |
| 125 | 🇺🇬 Uganda | $18 |
| 126 | 🇿🇼 Zimbabwe | $17 |
| 127 | 🇿🇲 Zambia | $16 |
| 128 | 🇲🇺 Mauritius | $16 |
| 129 | 🇨🇲 Cameroon | $16 |
| 130 | 🇳🇵 Nepal | $15 |
| 131 | 🇳🇬 Nigeria | $14 |
| 132 | 🇳🇮 Nicaragua | $12 |
| 133 | 🇬🇼 Guinea-Bissau | $12 |
| 134 | 🇹🇿 Tanzania | $12 |
| 135 | 🇨🇺 Cuba | $11 |
| 136 | 🇷🇼 Rwanda | $11 |
| 137 | 🇲🇩 Moldova | $11 |
| 138 | 🇵🇬 Papua New Guinea | $10 |
| 139 | 🇳🇪 Niger | $10 |
| 140 | 🇹🇯 Tajikistan | $9 |
| 141 | 🇨🇫 Central African Republic | $8 |
| 142 | 🇲🇿 Mozambique | $8 |
| 143 | 🇬🇭 Ghana | $8 |
| 144 | 🇧🇯 Benin | $7 |
| 145 | 🇧🇮 Burundi | $7 |
| 146 | 🇦🇫 Afghanistan | $6 |
| 147 | 🇬🇲 Gambia | $6 |
| 148 | 🇪🇹 Ethiopia | $5 |
| 149 | 🇻🇪 Venezuela | $5 |
| 150 | 🇲🇼 Malawi | $4 |
| 151 | 🇸🇱 Sierra Leone | $3 |
| 152 | 🇲🇬 Madagascar | $3 |
| 153 | 🇨🇩 Dem. Rep. of Congo | $3 |
| 154 | 🇱🇷 Liberia | $3 |
| 155 | 🇭🇹 Haiti | $2 |
| 156 | 🇨🇷 Costa Rica | $0 |
| 157 | 🇮🇸 Iceland | $0 |
| 158 | 🇵🇦 Panama | $0 |
Measured this way, we get a perspective of how small defense budgets can be per person, even if the total expenditure is large.
For example, India has the fourth-highest total defense expenditure in 2022, but because of its massive population only sets aside $53 per resident for its military, putting it solidly at the bottom third of the per-capita rankings.
Patterns Revealed By Measuring Military Spend
Changing how we look at a country’s military budget can reveal a lot more than just looking at absolute numbers.
For example, the Middle East is the region with the highest spenders on defense as a percentage of their GDP, giving us insight into regional security concerns.
Countries from the medium group of military spending—including parts of Eastern Europe, sub-Saharan Africa, and South Asia—highlight past or recent conflict zones between neighbors, countries with internal strife, or countries wary of a regional aggressor. Ukraine’s average per capita military spend, for example, was just $122.4 from 2018 to 2021. The next year, it jumped nearly 10 times to $1,018.66 per person after Russia’s invasion.
In fact, European military spending saw its sharpest one-year jump in 30 years as a direct result of the war.
Alongside European anxieties, ongoing tension between China and Taiwan has also contributed to increased military spending in Asia and Oceania. Will these budgets continue their dramatic ascent or will they rise evenly alongside their relative economies in 2023?
Data note: For these comparisons, the creator is calculating five-year averages (using data from 2018-2022) for military spending as a percentage of GDP and per-capita military spending for each country. The military expenditure data is pulled from Stockholm International Peace Research Institute.
Data for some countries is missing or may vary significantly from official figures. Countries with up to
two years of missing data had averages calculated on the years available, while countries with three or more years of missing data have been removed from this dataset, including: Djibouti, Eritrea, North Korea, Laos, Libya, Somalia, Syria, Turkmenistan, UAE, and Yemen.
Please see SIPRI’s methodologies page for more details on how they collect their data and create estimates.

This article was published as a part of Visual Capitalist's Creator Program, which features data-driven visuals from some of our favorite Creators around the world.


Public Opinion
Charted: How Americans Feel About Federal Government Agencies
Fourteen of 16 federal government agencies garnered more favorable responses than unfavorable ones. But what were the outliers?
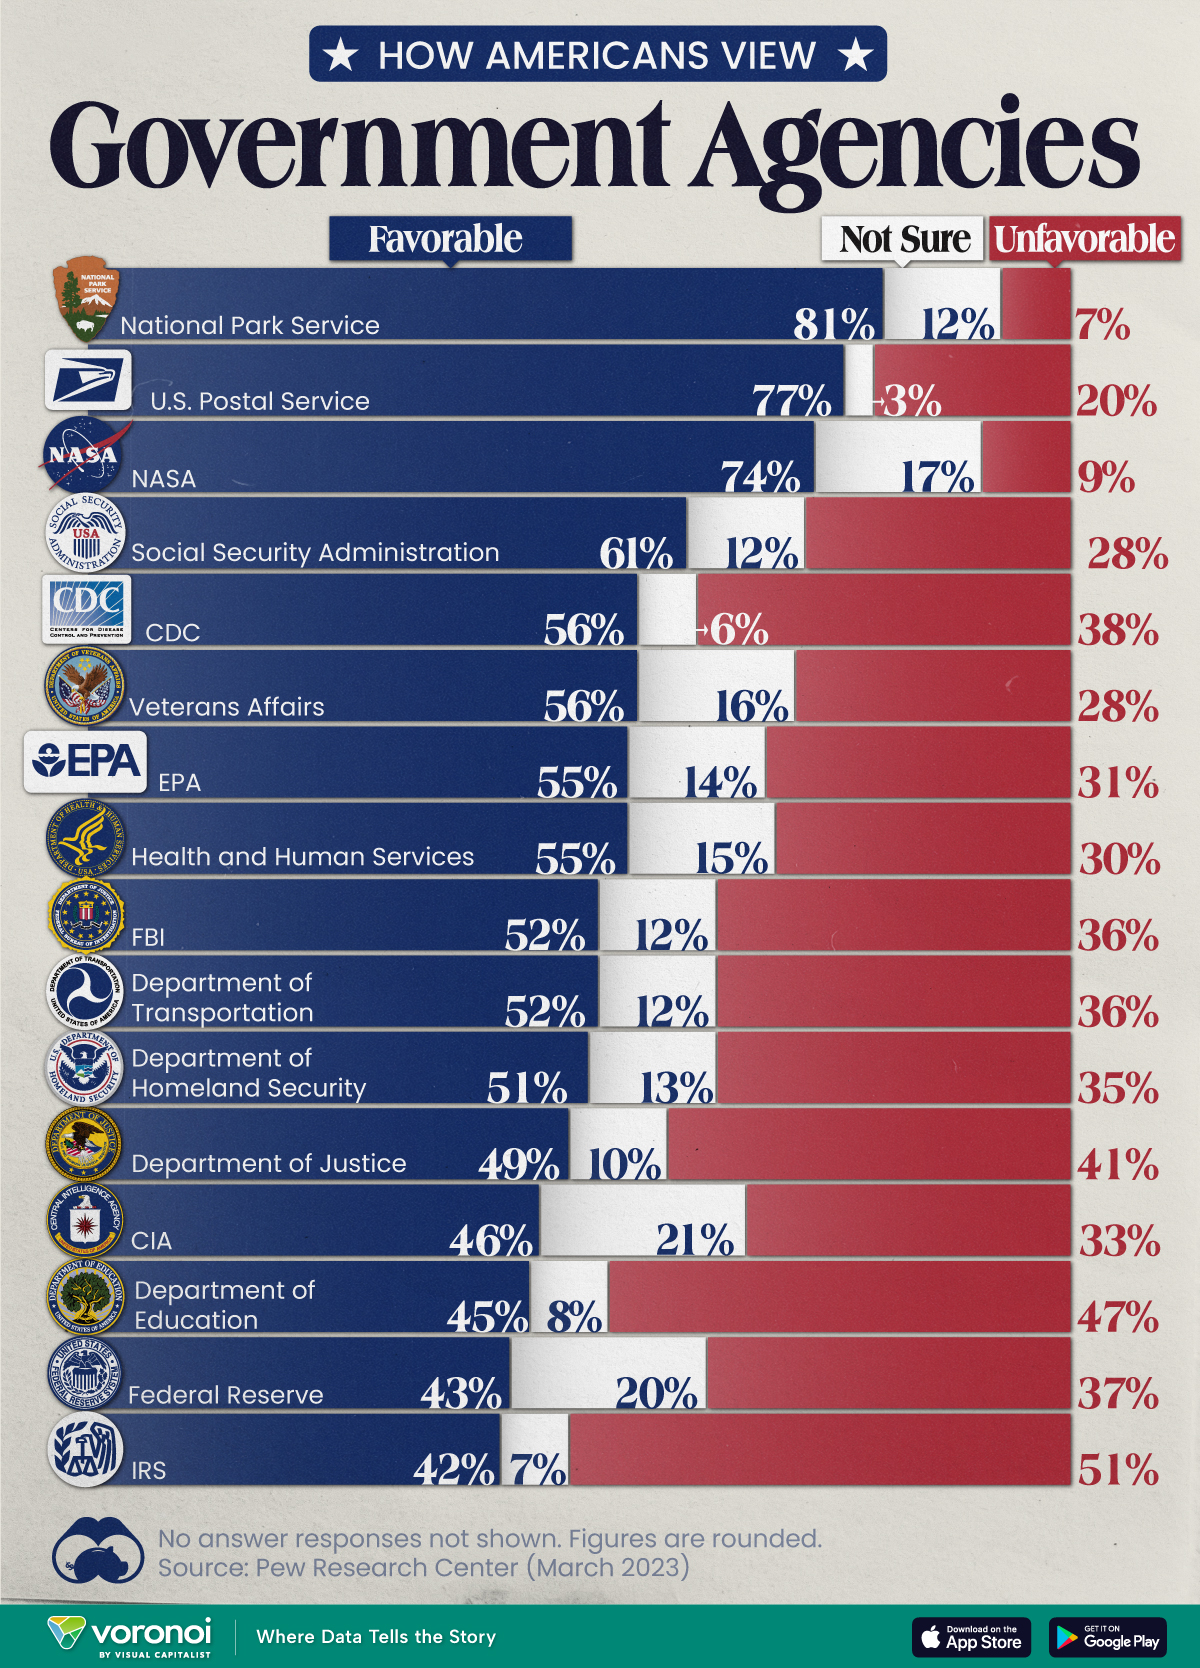
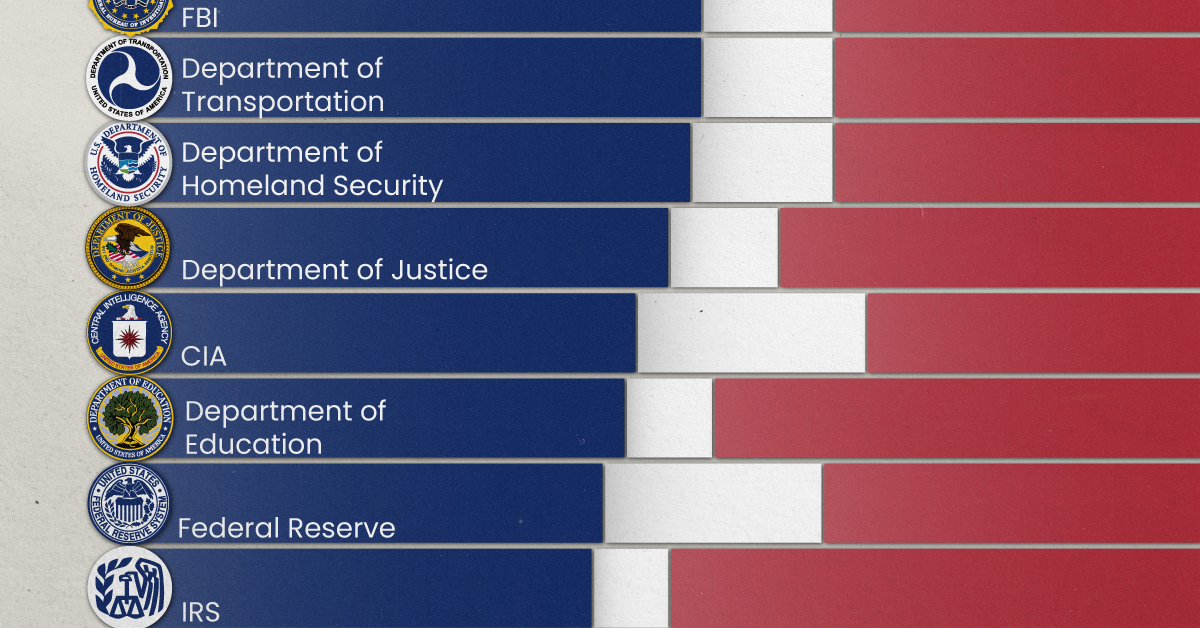
Chart: How Americans Rate 16 Federal Government Agencies
This was originally posted on our Voronoi app. Download the app for free on iOS or Android and discover incredible data-driven charts from a variety of trusted sources.
Come election time, America won’t hesitate to show its approval or disapproval of the country’s elected political representatives. That said, feelings about the federal bureaucracy and its associated agencies are a little harder to gauge.
We chart the results from an opinion poll conducted by Pew Research Center between March 13-19, 2023. In it, 10,701 adults—a representative of the U.S. adult population—were asked whether they felt favorably or unfavorably towards 16 different federal government agencies.
Americans Love the Park Service, Are Divided Over the IRS
Broadly speaking, 14 of the 16 federal government agencies garnered more favorable responses than unfavorable ones.
Of them, the Parks Service, Postal Service, and NASA all had the approval of more than 70% of the respondents.
| Agency | Favorable | Unfavorable | Not sure |
|---|---|---|---|
| 🏞️ National Park Service | 81% | 7% | 12% |
| 📮 U.S. Postal Service | 77% | 20% | 3% |
| 🚀 NASA | 74% | 9% | 17% |
| 💼 Social Security Administration | 61% | 28% | 12% |
| 🔬 CDC | 56% | 38% | 6% |
| 🎖️ Veterans Affairs | 56% | 28% | 16% |
| 🌿 EPA | 55% | 31% | 14% |
| 💉 Health & Human Services | 55% | 30% | 15% |
| 🕵️ FBI | 52% | 36% | 12% |
| 🚗 Department of Transportation | 52% | 36% | 12% |
| 🛡️ Department of Homeland Security | 51% | 35% | 13% |
| ⚖️ Department of Justice | 49% | 41% | 10% |
| 🕵️♂️ CIA | 46% | 33% | 21% |
| 📚 Department of Education | 45% | 47% | 8% |
| 💰 Federal Reserve | 43% | 37% | 20% |
| 💼 IRS | 42% | 51% | 7% |
Note: Figures are rounded. No answer responses are not shown.
Only the Department of Education and the IRS earned more unfavorable responses, and between them, only the IRS had a majority (51%) of unfavorable responses.
There are some caveats to remember with this data. Firstly, tax collection is a less-friendly activity than say, maintaining picturesque parks. Secondly, the survey was conducted a month before taxes were typically due, a peak time for experiencing filing woes.
Nevertheless, the IRS has come under fire in recent years. As per a New York Times article in 2019, eight years of budget cuts have stymied the agency’s ability to scrutinize tax filings from wealthier and more sophisticated filers.
At the same time poorer Americans are facing increasing audits on wage subsidies available to low income workers. According to a Transactional Records Access Clearinghouse report, this subset of filers was audited five-and-a-half more times the average American.

-

 Markets4 days ago
Mapped: The Most Valuable Company in Each Southeast Asian Country
-

 Markets2 weeks ago
The Top Private Equity Firms by Country
-

 Jobs2 weeks ago
The Best U.S. Companies to Work for According to LinkedIn
-

 Economy2 weeks ago
Ranked: The Top 20 Countries in Debt to China
-

 Politics1 week ago
Charted: Trust in Government Institutions by G7 Countries
-

 Energy1 week ago
Mapped: The Age of Energy Projects in Interconnection Queues, by State
-

 Mining1 week ago
Visualizing Global Gold Production in 2023
-

 Markets1 week ago
Visualized: Interest Rate Forecasts for Advanced Economies