 Dominic Chavez/World Bank
The COVID-19 pandemic triggered the most synchronous economic downturn in more than a century. Ninety-percent of countries posted a decline in real per capita GDP in 2020, more than any other year since 1900 -- including two world wars and the economic depression of the 1930s. The health crisis pushed an estimated 120 million people into extreme poverty. For Emerging Markets and Developing Economies (EMDEs) however, the setback in their development markers did not start with the pandemic. COVID-19 deepened and accelerated a troubling trend of economic backsliding that had appeared around half a decade earlier. We call this the Reversal Problem .
The 21st century saw many positive trends in EMDEs: poverty reduction, a narrowing of the gap between rich and poor nations, higher growth rates in per capita incomes, and a much lower incidence of economic crises. Equality within countries gained a stronger footing and many social indicators improved. In 2015, the largest decline in commodity prices since the early 1980s was followed by an emerging reversal of these development gains, and COVID-19 worsened these setbacks.
The Reversal Problem is widespread in terms of geography, though more acute in Africa and other low-income regions. It not only affects economic and social indicators but is potentially politically destabilizing internally and across national borders, as the reversal in economic and social outcomes appears to coincide with a setback in democratic values.
The bonanza years from 2000-2015 followed the calamitous 1980s which had marked an earlier reversal in development in scores of low- and middle-income countries (Figure 1, Table 1). The commonality in these economic, social, and political indicators is that they follow a distinctive U-shape pattern, from worse-to better-back to worse -- indicating that across many dimensions EMDEs as a group have been moving from progress to stagnation to reversal.
Figure 1. The Big Picture: Real per capita GDP EMDEs unweighted average, 1980-2021
Index 2019=100
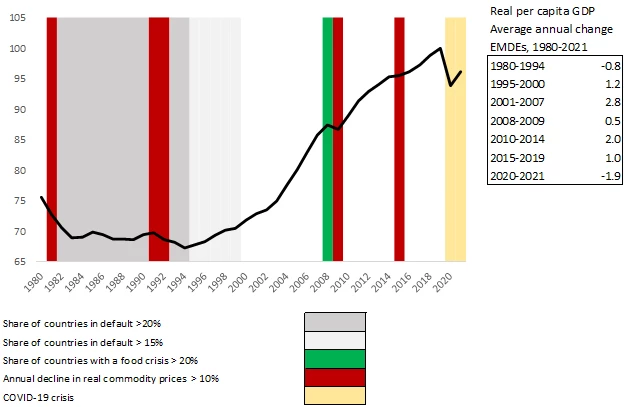
Sources: World Economic Outlook, IMF, Farah, Graf Von Luckner, and Reinhart (2022), and Graf Von Luckner, Holston, and Reinhart (2022).
The ‘bonanza years’ for EMDEs
The EMDE debt overhang of the 1980s was addressed in the early 1990s for middle-income countries by the Brady Plan and later for low-income countries through the Heavily Indebted Poor Countries (HIPC) debt relief initiative. The resolution of these protracted debt crises paved the way for recovery. For EMDEs, the first decade of the 21st century saw growth in per capita GDP outstripping that of advanced economies (AEs) by a widening margin (Figure 2). The share of EMDEs with negative 5-year real GDP growth declined from 40 percent in the early 1990s to less than 10 percent in 2008. Social conditions improved significantly compared to the previous two decades, with considerable declines in poverty rates and a more equitable income distribution.
Figure 2. Real per capita GDP growth differential: Advanced Economies less EMDEs, 1992-2021 (percent)

Source: Authors’ calculations and World Economic Outlook, IMF.
Robust economic growth allowed EMDEs to improve their fiscal and external positions and strengthen their financial sector policy frameworks. There was a significant reduction in the high inflation and debt and financial crises of the 1970s to 1990s, so central banks maintained low policy rates and rising international reserves strengthened external buffers. EMDE current account deficits narrowed, on average, from 3.5 percent of GDP in 2001 to 1.2 percent GDP in 2007. About 70 percent of EMDEs increased their international reserves-to-external debt ratio by more than 10 percentage points while one-quarter posted increases of more than 50 percentage points. Many EMDEs faced the 2009 global recession with greater resilience than in the past.
Sustained growth also helped to reduce global poverty and inequality. The number of countries classified as low income declined from 66 in 2001 to 31 in 2015, while extreme poverty fell from 30 percent of the global population in 2000 to 10 percent in 2015. Between-country inequality improved, reducing the global Gini index from 69.7 in 1999 to 62 in 2015. In most EMDEs, within-country inequality also declined. In Latin America, for instance, from 2000 to 2015, more than 50 million people were lifted out of poverty and the middle class swelled to more than a third of the population. Educational gaps were reduced. For example, between 2000 and 2016, in India lower-secondary completion rates increased from 53 percent in 2002 to 86 percent and for the average low-middle income country increased from 57 to 74 percent.
However, the new prosperity possibly owed less to a lasting shift in EMDE’s fundamentals than to sustained favorable external conditions. An important factor was China’s rapid investment-led growth, which lifted global commodity prices and fueled the longest commodity boom since the early 19th century. Another engine of growth was the surge in world trade, which as a share of world GDP, rose from less than 40 percent in 1990 to over than 60 percent in 2011. Importantly, globalized finance and low interest rates in financial centers incentivized risk-taking, and investors sought opportunities in emerging markets. Gross capital inflows to EMDEs excluding foreign direct investment swelled nearly seven-fold (from 1 percent of GDP in 2001 to 6.5 percent in 2007).
The onset of the Reversal Problem
During 2015-2019, real per capita GDP growth in EMDEs slowed markedly, averaging one percent, or one half the growth rate of the previous five years and about a third of the 2000-2007 rate. This was followed by the COVID-19 outbreak, and a regressive and uneven rebound in 2021. In 2021 more than a third of AEs reached a new peak in per capita income (Holston, and Reinhart, 2022). By contrast, for middle- and low-income EMDEs, the share of countries at peak per capita GDP in 2021 is much lower, about 21 percent and 12 percent, respectively. This means that 80 to 90 percent of EMDEs were below their prior per capita income levels.
This suggests that the crisis may have lasting effects on growth through its impact on human capital and income inequality, while the economic setback is evident in other macroeconomic variables . The re-emergence of debt problems, particularly in low-income countries, figures prominently in the Reversal Problem. Levels of public indebtedness also follow a distinctive U-shaped pattern (Figure 3).
EMDEs managed to weather the 2008-2009 crisis thanks to fiscal buffers and sustained deleveraging during the years leading up to that crisis but since then, debt and budget deficits have risen steadily, denting resilience. The fiscal health of commodity-exporting EMDEs deteriorated sharply, and the setback in public finances has been mirrored in a reverse-U in the sovereign credit ratings of EMDEs, as the steady improvement in ratings during the high growth era has been replaced by recurrent downgrades (Figure 4). While public debt loads were mounting in most EMDEs well before 2019, the pandemic-induced crash in economic activity and government revenues pushed several “graduates” of the Brady and HIPC plans back into debt distress territory.
The reversal in inflation is of more recent vintage and common to AEs. In a manner reminiscent of 2008, although on a lesser scale (to date), food price inflation, with its regressive impacts, has also reemerged. The rekindling of inflationary pressures, even prior to the Russia-Ukraine war, was proving to be more persistent than anticipated by many central banks and will represent a challenge to the relatively new-found central bank independence in EMDEs.
Figure 3. General government debt-to-revenue ratio: EMDEs, 1990-2021
(in percent)
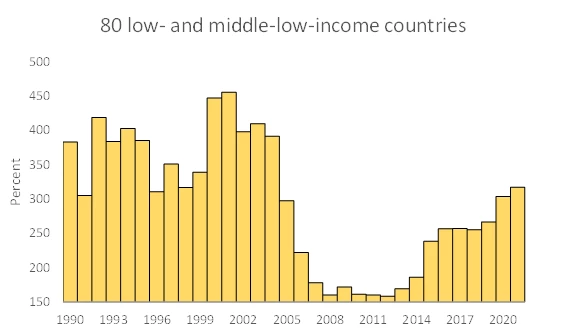

Source: Authors’ calculations and World Economic Outlook, IMF.
Figure 4. The Reverse U: Fitch, Institutional Investors, Moody's, and S&P Sovereign Ratings: Average Numeric Score: EMDEs, 1990:1-2022:3

Sources: Fitch, Moody’s, Standard & Poor’s, and Nickols et.al. (2022).
The reversal in inequality and poverty
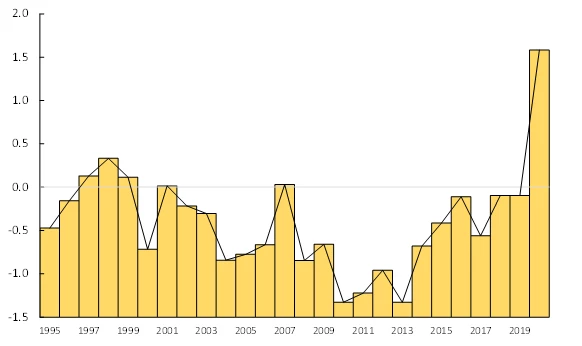
Following two decades of progress, progress on reducing poverty and inequality has also suffered a marked reversal. The sustained decline in extreme poverty that began in the 1990s was already stalling in the pre-COVID-19 decade (Figure 5). World Bank data shows that from 1990 to 2015 extreme global poverty dropped by an average of about 1 percentage point per year, then slowed from 2013 to 2015 to 0.6 percentage points per year before slowing further in the years before COVID-19. As the health crisis persisted, stalling morphed into outright reversal.
The slowdown in global poverty reduction is partly accounted for by the increasing concentration of extreme poverty: in Sub-Saharan Africa, which has experienced a slower reduction in poverty than any other region, and in poverty spikes in the Middle East and North Africa, where extreme poverty rates nearly doubled between 2015 and 2018, from 3.8 percent to 7.2 percent, spurred by the ongoing conflicts (World Bank 2020).
The poverty reversal can be gleaned from the share of countries that have higher rates of extreme poverty than the average during the prior 5 years. From 1995 to 2008 the share of EMDEs with worsening poverty dropped from 42 percent to less than 10. Then progress stalled, the share climbed back to 18 percent in 2019 before surging to almost 42 percent in 2020. Extreme poverty has continued to increase since. World Bank estimates suggest that the COVID-19-induced extreme poverty is set to rise by 0.9 percentage points, and even more in Sub-Saharan Africa (Narayan et al., 2022).
Figure 5. Annual change in the global poverty rate, 1992-2020
(5-year moving average, in percent)

Sources: Authors’ calculations based on data from Mahler, Yonzan and Lakner (2022). Notes: This chart shows the 5-year rolling average of the annual percent change in the global poverty rate ( $1.90 poverty line), using the global distributions in Poverty and Inequality Portal (PIP) for the historical series and the simulations by Mahler, Yonzan and Lakner (2022).
The pandemic has been particularly harsh on the urban poor, and notably women (Mahler et al, 2022). In many cases, the COVID-19 rise in inequality reinforced trends already in place (World Bank, 2020). Faster economic growth during 2000-2010 facilitated a decline in within-country income inequality globally, albeit from historically high levels in the 1990s and early 2000s. Income inequality declined in more than 60 percent of EMDEs, as measured by the Gini Index. As with poverty reduction, improvement had stalled in the years prior to the pandemic, when the reversal materialized in earnest. In stark contrast to the global financial crisis of 2008-10, the lagging economic recovery in EMDEs compared with AEs have raised between-country income inequality (Figure 6). According to the Gini and Theil indices, between-country inequality reverted to the levels of the early 2010s. Within-country income inequality in EMDEs has also increased in 2020 (by about 0.3 points), reversing the steady decline since the 2000s (The World Bank, 2022).
The human capital reversal
The accumulation of human capital has been severely disrupted in most EMDEs, and the pandemic has had a disproportionate impact on children from low-income households. The long-term consequences of students missing many days of school and some, notably girls, not returning to the classroom cannot be underestimated as a fault line in the development process.
Figure 6. Global interpersonal Income inequality: Global Gini, 1995-2020
Rolling 5-year average of annual change
Source: Authors’ calculations and Mahler, Yonzan and Lakner (2022).
Note: This chart shows annual percentage change in the global Gini index (5-year moving average), using the global distributions in PIP for the historical series and the simulations conducted by Mahler, Yonzan and Lakner (2022).
School closures affected 1.6 billion children across the globe, but lower- and middle-income countries have closed schools for far longer than their higher-income counterparts. In parts of South Asia, Latin America, and Africa, schools were closed for over 80 weeks. Uganda, which reopened schools in January 2022, topped the charts with 82 weeks of partial or full closure. Recent research suggests that in Latin America, the likelihood of today’s disadvantaged students completing secondary education has dropped from a regional average of 61 percent to 46 percent (Figure 7). Such averages mask the striking differences across socioeconomic groups -- although school closures affected all students, their ability to continue learning depended on their parent's income and educational level. Children in disadvantaged households found it difficult, if not impossible, to continue their education at home due to lack of adequate equipment, connectivity and one-on-one coaching by well-educated parents. For these children, the odds of completing secondary school may be closer to 32 percent, a level of educational attainment that was last reported for cohorts born in the 1960s.
Figure 7. Likelihood that disadvantaged children do not complete secondary education: Latin America, 1941-2005
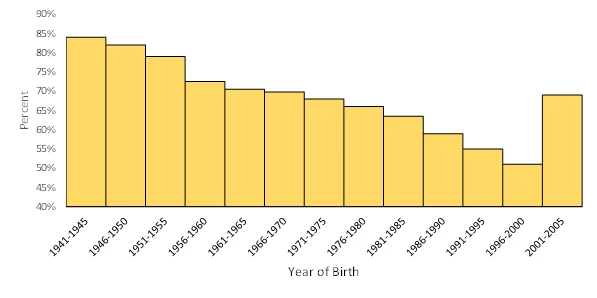
Sources; Neidhöfer, Lustig, and Tommasi (2020) based on data from Latinobarometro.
Notes: This chart shows the likelihood that children, whose parents have less than secondary education, will complete secondary education. Unweighted average. These estimated are based on pre-pandemic data.
COVID-19 has also set back the provision of health services in EMDEs. Evidence compiled by the World Health Organization and the World Bank shows that the COVID-19 pandemic is likely to halt two decades of global progress towards Universal Health Coverage. Many EMDEs had made progress on service coverage and by 2019, 68 percent of the world’s population was covered by essential health services, such as pre-and post-natal care; immunization services; treatment for diseases like HIV, TB and malaria; and services to diagnose and treat noncommunicable diseases like cancer and diabetes. The pandemic disrupted regular health services and stretched countries’ health systems. As a result, for instance, immunization coverage dropped for the first time in ten years, and the incidence of deaths from TB and malaria has increased.
Political reversals
Slower growth, increasing poverty and inequality, and dissatisfaction with the quality of public services, particularly evident in the (mis)management of the pandemic in many EMDEs, are contributing to dissatisfaction with governments and democratic values. According to data collected by Freedom House, the share of countries that are “not free” has followed a U-shaped pattern that mimics what we observe in other economic and social indicators (Figure 8). Societies around the world are experiencing radical political fractures that were deemed long gone. These manifestations preceded the pandemic but have spiked in the past two years.
Figure 8. Share of countries that are Not Free, 1993-2021

Source: Freedom House, https://freedomhouse.org/report/freedom-world
Note: This chart shows the percentage of 191 countries that have been classified as Not Free by Freedom in the World. For each country and territory, Freedom in the World analyzes the electoral process, political pluralism and participation, the functioning of the government, freedom of expression and of belief, associational and organizational rights, the rule of law, and personal autonomy and individual rights.
Violent conflicts have increased to the highest levels observed over the past three decades, affecting both low- and middle-income countries, and there were some 80 million forcibly displaced people worldwide as of end of 2019, the highest number recorded. Russia’s invasion of Ukraine is adding to those numbers daily (Figure 9).
Figure 9. Refugees as a percentage of world population, 1990-2021
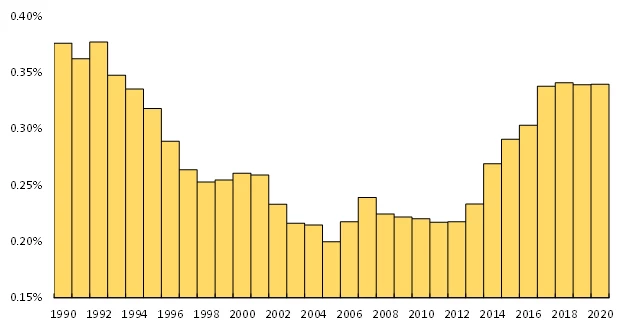
Source: World Bank WDI (2022).
Final thoughts
The COVID-19 crisis has set back many of the development markers where significant progress had been achieved, especially so in the many countries where the economic and social fundamentals had already started to backslide prior to the pandemic. While the setbacks are more acute in low-income countries, the trend is far more encompassing among EMDEs. If the past is any guide, policy reversals often follow closely on the heels of “bad times.” Policy reversals, in turn, set the stage for self-reinforcing economic and social setbacks. The international community and the advanced economies must come to terms with the heightened risks of delaying coordinated assistance replaying the calamitous 1980s. While the extent of the development Reversal Problem described here is not yet on the scale of development reversals of 40 years ago, there are added new risks posed by climate change that will disproportionally harm EMDEs.
The paper can also be found here, with references.


Join the Conversation