Container Port Performance Index 2022.pdf

This document presents the Container Port Performance Index (CPPI) 2022, which ranks the world's container ports based on how efficiently ships are handled. The CPPI analyzes data from over 3,000 ports collected by an automatic identification system to measure average ship arrival times and time spent at berths. It finds that average arrival times improved in 2022 after worsening during the pandemic in 2021. The report then ranks ports globally and by region based on their performance. Top performing ports tended to have high throughput volumes and were located in Asia, while ports in Africa and Latin America showed the most room for improvement. The CPPI aims to provide a standardized way to compare port performance over time and identify areas for increased efficiency.


![9 | Conclusions and Next Steps
on international trade costs, finding that doubling port efficiency in a pair of ports had the same impact
on trade costs as halving the physical distance between the ports. Hoffmann, Saeed, and Sødal (2020)
analyzed the short- and long-term impacts of liner shipping bilateral connectivity on South Africa’s trade
flows, and showed that gross domestic product (GDP), the number of common direct connections, and
the level of competition have a positive and significant effect on trade flows.
However, ports and terminals, particularly for containers, can often be the main sources of shipment
delays, supply chain disruptions, additional costs, and reduced competitiveness. Poorly performing ports
are characterized by limited spatial and operating efficiency, maritime and landside access, oversight,
and coordination among the public agencies involved, which lower predictability and reliability. The
result is that instead of facilitating trade, the port increases the cost of imports and exports, reduces
competitiveness, and inhibits economic growth and poverty reduction. The effect on national and regional
economies can be severe [see inter alia World Bank (2013)] and has driven numerous efforts to improve
performance to strengthen competitiveness.
Port performance is also a key consideration for container shipping lines that operate liner services on
fixed schedules, based on agreed pro-forma berth windows. Delays at any of the scheduled ports of call
on the route served by the vessel would have to be made good before the vessel arrives at the next port
of call, to avoid an adverse impact on the efficient operations of the service. As such, port efficiency and
port turnaround time at all the ports of call are important subjects for operators, and monitoring port
performance has become an increasingly important undertaking in the competitive landscape.
One of the major challenges to improving efficiency has been the lack of reliable measures to compare
operational performance across different ports. The old management idiom, ‘you cannot manage what
you cannot measure,’ is reflective of the historical challenge of both managing and overseeing the sector.
While modern ports collect data for performance purposes, it is difficult to benchmark the outcomes
against leading ports or ports with similar profiles due to the lack of comparative data.
Unsurprisingly, there is a long history of attempts to identify a comparative set of indicators to measure
port or terminal performance. A brief review of the literature was provided in The Container Port
Performance Index 2020: A Comparable Assessment of Container Port Performance (World Bank 2021),
CPPI 2020, which illustrated the broad approaches identified and commented on the merits and
demerits of each. The measures fell into three broad categories: Firstly, measures of operational and
financial performance; secondly, measures of economic efficiency; and thirdly, measures that rely,
predominately, on data from sources exogenous to the port. This review is not replicated in CPPI 2021,
and interested readers are directed to CPPI 2020 (World Bank 2021), or the extant literature. One of the
general challenges of nearly all the approaches has been the quality, consistency, and availability of data;
the standardization of definitions employed; and the capacity and willingness of organizations to collect
and transmit the data to a collating body.
At a slightly higher level, there are several aggregate indicators that provide an indication of the
comparative quality and performance of maritime gateways. The World Bank Logistics Performance
Index (LPI) (Arvis et al. 2018) and the World Economic Forum’s Global Competitiveness Index (GCI)
4.0 both report on the perceived efficiency of seaport services and border clearance processes and
indicate the extent to which inefficiencies at a nation’s sea borders can impact international trade
competitiveness. But the aggregate nature of the indicators, and the fact that they are perception
based, means that they offer at best an indication of comparative performance and offer little to guide](https://image.slidesharecdn.com/containerportperformanceindex2022-230518111832-53f27e7c/85/Container-Port-Performance-Index-2022-pdf-17-320.jpg)


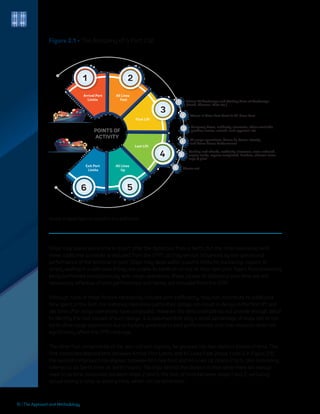
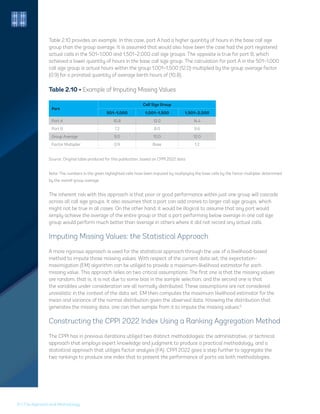
![Borda-type approach for index aggregation
Rank aggregation, that is the process of combining multiple rankings into a single ranking, is an
important problem arising in many areas (Langville and Meyer 2012). For example, in a ranked voting
system, citizens rank candidates in their order of preference and a single winner needs to be determined.
Similarly, recommender systems and search engines can produce many different rankings of items that
are likely to be of interest to a given user. Such rankings can naturally be aggregated to produce a more
robust list of items (Pappa et al. 2020).
Many strategies were proposed in the literature to combine several rankings into one that is as consistent
as possible with the individual rankings (Langville and Meyer 2012, Fagin et al. 2003, Dwork et al. 2001,
Dwork et al. 2012, Oliveira et al. 2020) and references therein. The Borda count (Langville and Meyer 2012,
Chapter 14) provides a simple and effective approach for aggregating rankings, wherein each item to rank is
given points according to the number of items it outranks in its segment. These points are added and then
used to produce a new ranking. Our approach to combine the administrative and the statistical rankings is
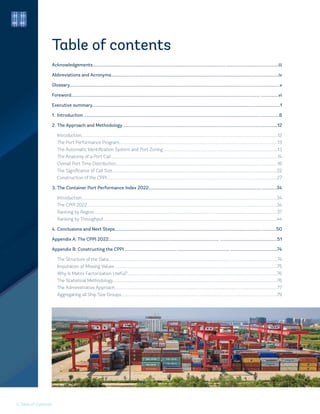
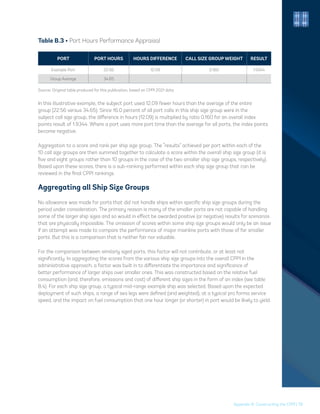
inspired by the Borda count, but also considers the index values for attributing the number of points.
The process is as follows: First, each index is scaled to take values into the interval [0,1]. This is
accomplished by applying the following linear transformation:
where m is the minimum value of the index and M the maximum value. Observe that the port with the
smallest index is always given a scaled value of 0 and the port with largest index a scaled value of 1. The
other ports get a scaled value between 0 and 1. Once the indices are scaled, they are added to produce
a combined index. Finally, a ranking is obtained by sorting the ports according to the combined index
in decreasing order. Thus, the port with the largest combined index is ranked first and the port with the
smallest combined index is ranked last.
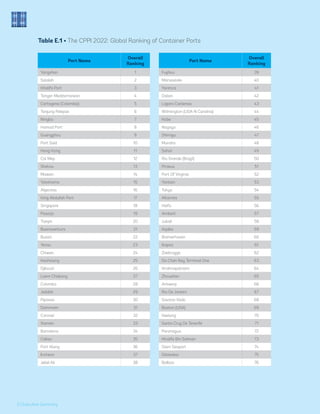
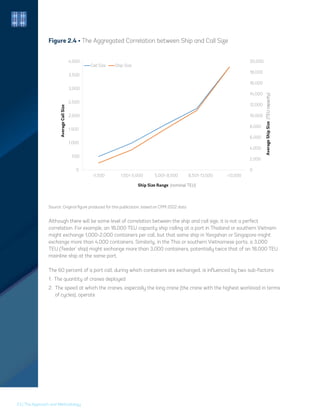
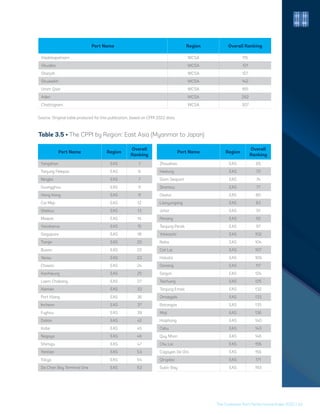
Table 2.11 • An Example of Aggregated Rankings for Four Ports with Randomly
Generated Administrative and Statistical Index Values
Ports
Administrative
Index
Statistical
Index
Scaled
Administrative
Index
Scaled
Statistical
Index
Combined
Index
Final Ranking
Port 1 1.45 1.97 1.000 1.000 2.000 1
Port 2 1.26 1.21 0.678 0.392 1.070 3
Port 3 1.23 1.31 0.627 0.472 1.099 2
Port 4 0.86 0.72 0.000 0.000 0.000 4
Source: Original table produced for this publication, based on CPPI 2022 data.
For example, the scaled administrative index value of Port 2 (x = 1.26) is computed as follows: the minimum
and maximum values of the administrative index are m = 0.86 and M = 1.45. Thus, the scaled value is
The Approach and Methodology | 32](https://image.slidesharecdn.com/containerportperformanceindex2022-230518111832-53f27e7c/85/Container-Port-Performance-Index-2022-pdf-40-320.jpg)


![[2] ship classification and types](https://cdn.slidesharecdn.com/ss_thumbnails/2shipclassificationandtypes-120403042444-phpapp01-thumbnail.jpg?width=560&fit=bounds)


More Related Content
What's hot (20)
Similar to Container Port Performance Index 2022.pdf (7)


More from El Estrecho Digital (20)


Recently uploaded (20)


Container Port Performance Index 2022.pdf
- 1. Transport Global Practice The Container Port Performance Index 2022 A Comparable Assessment of Performance based on Vessel Time in Port Public Disclosure Authorized Public Disclosure Authorized Public Disclosure Authorized Public Disclosure Authorized
- 2. © 2023 International Bank for Reconstruction and Development / International Development Association or The World Bank 1818 H Street NW Washington, DC 20433 Telephone: 202-473-1000 Internet: www.worldbank.org This work is a product of the staff of The World Bank, together with external contributions from S&P Global Market Intelligence. The findings, interpretations, and conclusions expressed in this work do not necessarily reflect the views of The World Bank, its Board of Executive Directors, or the governments they represent. The World Bank does not guarantee the accuracy of the data included in this work. The boundaries, colors, denominations, and other information shown on any map in this work do not imply any judgment on the part of The World Bank concerning the legal status of any territory or the endorsement or acceptance of such boundaries. Nothing herein shall constitute or be considered to be a limitation upon or waiver of the privileges and immunities of The World Bank, all of which are specifically reserved. Rights and Permissions This work is available under the Creative Commons Attribution 3.0 IGO license (CC BY 3.0 IGO) http://creativecommons.org/licenses/by/3.0/igo.+ Under the Creative Commons Attribution license, you are free to copy, distribute, transmit, and adapt this work, including for commercial purposes, under the following conditions: Attribution—Please cite the work as follows: The World Bank, 2023. “The Container Port Performance Index 2022: A Comparable Assessment of Performance based on Vessel Time in Port (Fine).” World Bank, Washington, DC. License: Creative Commons Attribution CC BY 3.0 IGO. Translations—If you create a translation of this work, please add the following disclaimer along with the attribution: This translation was not created by The World Bank and should not be considered an official World Bank translation. The World Bank shall not be liable for any content or error in this translation. Adaptations—If you create an adaptation of this work, please add the following disclaimer along with the attribution: This is an adaptation of an original work by The World Bank. Views and opinions expressed in the adaptation are the sole responsibility of the author or authors of the adaptation and are not endorsed by The World Bank. Third-party content—The World Bank does not necessarily own each component of the content contained within the work. The World Bank, therefore, does not warrant that the use of any third-party-owned individual component or part contained in the work will not infringe on the rights of those third parties. The risk of claims resulting from such infringement rests solely with you. If you wish to reuse a component of the work, it is your responsibility to determine whether permission is needed for that reuse and to obtain permission from the copyright owner. Examples of components can include, but are not limited to, tables, figures, or images. All queries on rights and licenses should be addressed to World Bank Publications, The World Bank Group, 1818 H Street NW, Washington, DC 20433, USA; fax: 202-522-2625; e-mail: pubrights@worldbank.org.
- 3. I | Table of Contents Table of contents Acknowledgements......................................................................................................................................................................iii Abbreviations and Acronyms..........................................................................................................................������......................iv Glossary..........................................................................................................................................................��������������������..............v Foreword.........................................................................................................................................................................................vi Executive summary........................................................................................................................................................................1 1. Introduction ..........................................................................................................................................������������������� .................8 2. The Approach and Methodology ......................................................................................................��������������������................12 Introduction..............................................................................................................................................�������.....................................................12 The Port Performance Program................................................................................................�..................................................................13 The Automatic Identification System and Port Zoning ..........................................................................����������������������������...............13 The Anatomy of a Port Call ..........................................................................����������������������������������������������������������������������������������...............14 Overall Port Time Distribution.......................................................................................................................����������������������������� ..................16 The Significance of Call Size.......................................................................................................................��������������������������������..................22 Construction of the CPPI.......................................................................................................................��������������������������������������..................27 3. The Container Port Performance Index 2022..................................................................................................................34 Introduction........................................................................................................................................������������������������������������� ...........................34 The CPPI 2022.............................................................................................................................����������������������������������� ..................................34 Ranking by Region.......................................................................................................................����������������������������������������.............................37 Ranking by Throughput ................................................................................................�������������������������������������������������� ..............................44 4. Conclusions and Next Steps................................................................................................................................................50 Appendix A: The CPPI 2022......................................................................................................................................................51 Appendix B: Constructing the CPPI ..............................................����������������������������������������������� ..........................................74 The Structure of the Data..............................................................................................................................�������........................................74 Imputation of Missing Values .........................................................................................................��������������������������...................................75 Why Is Matrix Factorization Useful?................................................................................................�������������������������.................................76 The Statistical Methodology.........................................................................................................���������������������������.....................................76 The Administrative Approach.........................................................................................................�������������������������.....................................77 Aggregating all Ship Size Groups.........................................................................................................������������������.....................................79
- 4. Table of Contents | II Tables Table E.1. • The CPPI 2022: Global Ranking of Container Ports..............................................�����������������.......................................3 Table 2.1 • Average Arrival Time Development per Region and Ship Size, 2021-2022............................................�������������.18 Table 2.2 • Top 20 Ports that Most Reduced Average Arrival Times, 2021-2022 ....................���������������������������................ 19 Table 2.3 • Top 20 Ports that Increased Average Port Arrival Times, 2021-2022 .................�����������.................................. 20 Table 2.4 • Average Arrival Time Performance per Ship Size Range per Region ..................����������� ..................................... 21 Table 2.5 • Smaller Vessel Average Arrival Times ..............................................������������������ .............................................................. 21 Table 2.6 • Port Calls Distribution ..............................................��������������������........................................................................................ 28 Table 2.7 • Ship Size Group Definitions ................................................................������������������.............................................................. 28 Table 2.8 • Call Size Sensitivity .....................................................................���������������������..................................................................... 29 Table 2.9 • Quantity of Ports Included per Ship Size Group ..........................��������������................................................................ 30 Table 2.10 • Example of Imputing Missing Values .......................................�����������������..................................................................... 31 Table 2.11 • An Example of Aggregated Rankings for Four Ports with Randomly Generated Administrative and Statistical Index Values ........................................................������������������������ .............................................................................................. 32 Table 3.1 • The CPPI 2022 ..........................................................................��������������������� ........................................................................... 35 Table 3.2 • The CPPI by Region: North America ......................................����������������.......................................................................... 37 Table 3.3 • The CPPI by Region: Central America, South America, and the Caribbean Region .............���������............... 38 Table 3.4 • The CPPI by Region: West, Central, and South Asia (Saudi Arabia to Bangladesh) ..................�������������...... 39 Table 3.5 • The CPPI by Region: East Asia (Myanmar to Japan) .........................................�������������.......................................... 40 Table 3.6 • The CPPI by Region: Oceania (Australia, New Zealand, and the Pacific Islands) ..................���������� ................ 41 Table 3.7 • The CPPI by Region: Sub-Saharan Africa ...........................................................................�������������������� ...................... 42 Table 3.8 • The CPPI by Region: Europe and North Africa ......................................................�������������������� .................................. 43 Table 3.9 • The CPPI by Throughput: Large Ports (More than 4 million TEUs per Year) ............................������������� .......... 44 Table 3.10 • The CPPI by Throughput: Medium Ports (between 0.5 million and 4 million TEUs per Year)........������� ... 45 Table 3.11 • The CPPI by Throughput: Small Ports (Less than 0.5 million TEUs per Year) ........................������������........... 48 Figures Figure 2.1 • The Anatomy of a Port Call ...........................................................................������������������������������....................................... 15 Figure 2.2 • In-Port Time Consumption ......................................................................................���������������������������............................... 16 Figure 2.3 • Global Average Arrival Time Development ............................................................................����������������������................. 17 Figure 2.4 • The Aggregated Correlation between Ship and Call Size .........................................................��������������� ............. 23 Figure 2.5 • Container Moves Performed per gross Crane Hour across Various Ship Sizes ...........................������������ .... 24 Figure 2.6 • Gross Crane Productivity by Call Size ...................................................................................�������������������� ................... 25 Figure 2.7 • Crane Productivity by Crane Intensity ......................................................................................������������������������� ........... 25 Figure 2.8 • Call Size versus Crane Intensity ............................................................................................�����������������������.................. 26 Figure 2.9 • Average Moves per Crane ..........................................................................................................���������������������.................. 26 Figure 2.10 • The Structure of the CPPI .................................................................................................���������������������������.................... 27 Figure 2.11 • Percentage of Port Calls per Ship Size Group - 2022 ..........................................................�����������������................ 29
- 5. III | Acknowledgements Acknowledgements This technical report was prepared jointly by the teams from the Transport Global Practice of the Infrastructure Vice-Presidency at the World Bank and the Maritime, Trade and Supply Chain division of SP Global Market Intelligence. The World Bank team was led by Richard Martin Humphreys (Global Lead for Connectivity and Logistics and Lead Transport Economist, ITRGK), Grace Naa Merley Ashley (Transport Specialist, ITRGK), and Dominique Guillot (Associate Professor, University of Delaware), under the guidance of Binyam Reja (Global Practice Manager Transport, ITRGK) and Nicolas Peltier-Thiberge (Global Practice Director Transport, ITRGK). The SP Global Market Intelligence team was led by Turloch Mooney (Director, Global Intelligence Analytics), Andy Lane (Partner, CTI Consultancy), and Michelle Wong (Senior Research Analyst, GTI Product Management), under the guidance of Jenny Paurys (Head of Global Intelligence Analytics) and Guy Sear (Managing Director, Global Risk Maritime Global Intelligence Analytics). The joint team would like to extend special thanks to the following experts for their comments on the draft of the technical report: Jan Hoffmann (Chief, Trade Logistics Branch, Division on Technology and Logistics, United Nations Conference on Trade and Development, Geneva), Gylfi Palsson (Lead Transport Specialist, ILTC1), and Ninan Biju Oommen (Senior Transport Specialist, IEAT1).
- 6. Abbreviations and Acronyms | IV Abbreviations and Acronyms AIS Automatic Identification System CI Crane Intensity COVID-19 Coronavirus Disease 2019 CPPI Container Port Performance Index EEZ Exclusive Economic Zone FA Factor Analysis GCI Global Competitiveness Index GCMPH Moves per Gross Crane Hour GDP Gross Domestic Product GRT Gross Registered Tonnage ITU International Telecommunication Union LLDC Landlocked Developing Country LPI Logistics Performance Index SIDS Small Island Developing States TEU Twenty-foot Equivalent Unit UNCTAD United Nations Conference on Trade and Development
- 7. All fast: The point when the vessel is fully secured at berth and all mooring lines are fast Arrival time/hours: The total elapsed time between the vessel’s automatic identification system (AIS) recorded arrival at the actual port limit or anchorage (whichever recorded time is the earlier) and its all lines fast at the berth Berth hours: The time between all lines fast and all lines released Berth idle: The time spent on berth without ongoing cargo operations. The accumulated time between all fast to first move plus last move to all lines released Call size: The number of container moves per call, inclusive of discharge, load, and restowage Cargo operations: When cargo is being exchanged, the time between first and last container moves Crane intensity (CI): The quantity of cranes deployed to a ship’s berth call. Calculated as total accumulated gross crane hours divided by operating (first to last move) hours Factor analysis (FA): A statistical method used to describe variability among observed, correlated variables in terms of a potentially lower number of unobserved variables called factors Finish: Total elapsed time between last container move and all lines released Gross crane hours: Aggregated total working time for all cranes deployed to a vessel call without any deductions. Time includes breakdowns, inclement weather, vessel inspired delays, un/lashing, gantry, boom down/up plus hatch cover and gear-box handling. Gross crane productivity (GCMPH): Call size or total moves divided by total gross crane hours. Hub port: A port which is called at by deep-sea mainline container ships and serves as a transshipment point for smaller outlying, or feeder, ports within its geographical region. Typically, more than 35 percent of its total throughput would be hub and spoke or relay transshipment container activity. Moves: Total container moves. Discharge + restowage moves + load. Excluding hatch covers, gearboxes, and other non-container related crane work. Breakbulk cargo lifts are excluded, however empty platform (tweendeck or flat-rack) handling moves are included. Moves per crane: Total Moves for a call divided by the crane intensity. Port call: A call to a container port/terminal by a container vessel where at least one container was discharged or loaded. Port hours: The number of hours a ship spends at/ in port, from arrival at the port limits to sailing from the berth. Port limits: Either an anchorage zone or the location where pilot embarkation or disembarkation occurs and recorded as whichever activity is the earliest. Port to berth hours: The time from when a ship first arrived at the port limits or anchorage zone (whichever activity occurs first) until it is all fast alongside the berth. Relay transhipment: Containers transhipped between ocean going container ships. Ship size: Nominal capacity in twenty foot equivalent units (“TEU’s”). Start: The time elapsed from berthing (all lines fast) to first container move. Steam in time: The time required to steam-in from the port limits and until all fast alongside the berth. Twenty foot equivalent unit or TEU: A standard metric for container throughput, and the physical capacity of a container terminal. A 20-foot container is equal to 1 TEU, and a 40-foot or 45-foot container is equal to 2 TEUs. Regardless of container size (10 feet, 15 feet, 20 feet, 30 feet, 40 feet, or 45 feet), each is recorded as one move when being loaded or discharged from the vessel. Vessel capacity: Nominal capacity in twenty foot equivalent Units (“TEU’s”). Waiting time: Total elapsed time from when vessel enters anchorage zone to when vessel departs anchorage zone (vessel speed must have dropped below 0.5 knots for at least 15 mins within the zone). V | Glossary Glossary
- 8. Foreword | VI Foreword The challenges caused by the COVID-19 pandemic and its aftermath on the sector eased in 2022, an easing that has continued into early 2023. This has resulted in an improvement in both port congestion and a reduction in logistical disruption. The improvement in 2022 has had a positive impact on the performance and ranking of some ports; where the problem was systemic, as opposed to location specific, the inherent inefficiency remains. One of the ‘silver linings’ of the pandemic was greater awareness and focus on the resilience and efficiency of the maritime gateways, where any friction will result in tangible impacts on consumer choice, price and ultimately economic development. However, one of the major challenges to stimulating improvement in the efficiency of ports has been the lack of a reliable, consistent, and comparable basis on which to compare operational performance across different ports. While modern ports collect data for performance purposes, the Quality, consistency, and availability of data, the definitions employed, and the capacity and willingness of the organizations to collect and transmit data to a collating body have all precluded the development of a robust comparable measure(s) to assess performance across ports and time. The introduction of new technologies, increased digitalization, and the willingness on the part of industry stakeholders to work collectively toward systemwide improvements have now provided the opportunity to measure and compare container port performance in a robust and reliable manner. A partnership has resulted in this technical report, which is the third iteration of the Container Port Performance Index (CPPI), produced by the Transport Global Practice of the World Bank in collaboration with the Global Intelligence Analytics division of SP Global Market Intelligence. The CPPI is intended, as in its earlier iterations, to serve as a reference point for improvement for key stakeholders in the global economy, including national governments, port authorities and operators, development agencies, supranational organizations, various maritime interests, and other public and private stakeholders in trade, logistics, and supply chain services. The performance of a port may be assessed based on a myriad of measurements, such as: terminal capacity or space utilization, cost, landside connectivity services, or ship to shore interchange. The CPPI is based on available empirical objective data pertaining exclusively to time expended in a vessel stay in a port and should be interpreted as an indicative measure of container port performance, but not a definitive one. Nicolas Peltier-Thiberge Global Practice Director Transport The World Bank Jenny Paurys Head of Global Intelligence Analytics SP Global Market Intelligence
- 9. 1 | Executive Summary Executive Summary Maritime transport forms the foundation of global trade and the manufacturing supply chain. The maritime industry provides the most cost-effective, energy-efficient, and dependable mode of transportation for long distances. More than 80 percent of global merchandise trade (by volume) is transported via sea routes. A considerable and increasing proportion of this volume, accounting for about 35 percent of total volumes and over 60 percent of commercial value, is carried in containers. The emergence of containerization brought about significant changes in how and where goods are manufactured and processed, a trend that is likely to continue with digitalization. Container ports are critical nodes in global supply chains and essential to the growth strategies of many emerging economies. In numerous cases, the development of high-quality container port infrastructure operating efficiently has been a prerequisite for successful export-led growth strategies. Countries that follow such a strategy will have higher levels of economic growth than those that do not. Efficient, high quality port infrastructure can facilitate investment in production and distribution systems, engender expansion of manufacturing and logistics, create employment opportunities, and raise income levels. However, ports and terminals, especially container terminals, can cause shipment delays, disruptions in supply chain, additional expenses, and reduced competitiveness. The negative effect of poor performance in a port can extend beyond the that port’s hinterland to others as container shipping services follow a fixed schedule with specific berth windows at each port of call on the route. Therefore, poor performance at one port could disrupt the entire schedule. This, in turn, increases the cost of imports and exports, reduces the competitiveness of the country and its hinterland, and hinders economic growth and poverty reduction. The consequences are particularly significant for landlocked developing countries (LLDCs) and small island developing states (SIDS). Comparing operational performance across ports has been a major challenge for improving global value chains due to the lack of a reliable, consistent, and comparable basis. Despite the data collected by modern ports for performance purposes, the quality, consistency, and availability of data, as well as the definitions used and the capacity and willingness of organizations to transmit data to a collating body, have hindered the development of a comparable measure(s) for assessing performance across ports and time. However, new technologies, increased digitalization, and industry interests’ willingness to work collectively toward systemwide improvements now provide an opportunity to measure and compare container port performance in a robust and reliable manner. The World Bank’s Transport Global Practice and the Global Intelligence Analytics division of SP Global Market Intelligence have collaborated to produce the third edition of the Container Port Performance Index (CPPI), presented in this technical paper. The aim of the CPPI is to pinpoint areas for enhancement that can ultimately benefit all parties involved, ranging from shipping lines to national governments and consumers. It is designed to act as a point of reference for important stakeholders in the global economy, including port authorities and operators, national governments, supranational organizations, development agencies, various maritime interests, and other public and private stakeholders in trade, logistics, and supply chain services. The development of the CPPI rests on total container ship in port time in the manner explained in subsequent sections of the report, and as in earlier
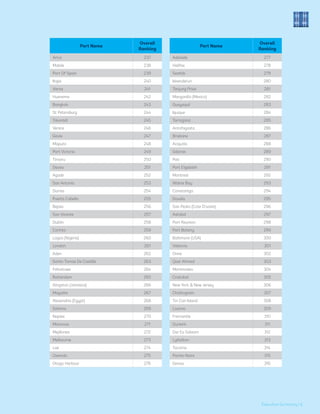
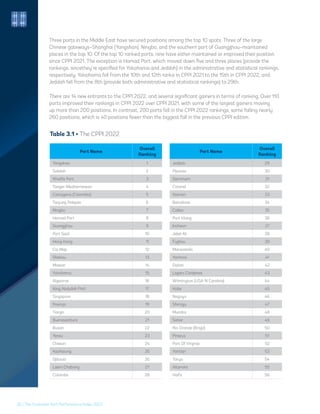
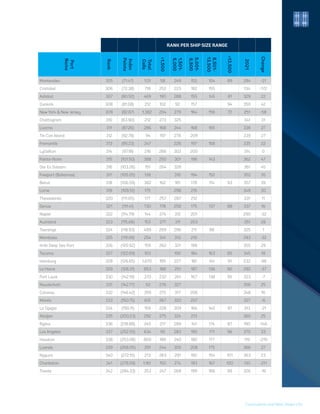
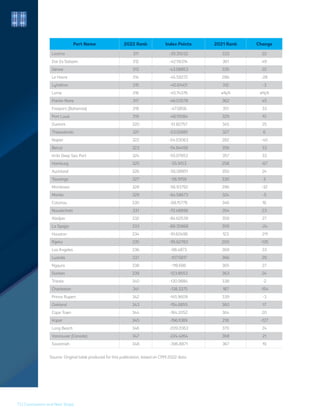
- 10. Executive Summary | 2 iterations of the CPPI. This third iteration utilizes data for the full calendar year of 2022. One slight change in this iteration is that the CPPI 2022 only includes ports that had a minimum of 24 valid port calls within the 12-month period of the study, compared to 20 in earlier iterations. The number of ports included in the CPPI 2022 is 348. In earlier iterations of the CPPI, the calculation of the ranking of the index employed two different methodological approaches, an administrative, or technical, approach, a pragmatic methodology reflecting expert knowledge and judgment; and a statistical approach, using factor analysis (FA). The rationale for using two approaches was to try and ensure that the ranking of container port performance reflects as closely as possible actual port performance, whilst also being statistically robust. And there has been a marked improvement in consistency between the rankings that result from the two approaches since the inaugural CPPI 2020, but some minor inconsistencies remained. Accordingly, for CPPI 2022, the same methodological approaches are used and then a rank aggregation method applied to combine the results from the two different approaches and return one aggregate ranking. The aggregation methodology and the resulting ranking is detailed in the report, while the statistical and administrative approaches and their respective rankings are detailed in Appendix A. Table E.1 presents the resulting CPPI 2022. The two top-ranked container ports in the CPPI 2022 are Yangshan Port (China) in first place, followed by the Port of Salalah (Oman) in second place. These two ports occupy the same positions in the rankings generated by both approaches. Port of Salalah was ranked second in both approaches in CPPI 2021. Yangshan Port ranked third and fourth in the statistical and administrative approaches, respectively, for CPPI 2021. Three ports in the Middle East are ranked in the top ten (Salalah, Kahlifa, Hamad), as are three of the large Chinese gateways (Yangshan, Ningbo and Guangzhou). Of the top 10 ranked ports, 9 have either maintained or improved their position since CPPI 2021. The exception is Hamad Port, which moved down 5 and 3 places in the administrative and statistical rankings, respectively. Yokohama fell from 10th and 12th in CPPI 2021 to 15th place in CPPI 2022, and Jeddah fell from 8th place in CPPI 2021 to 29th place in CPPI 2022.
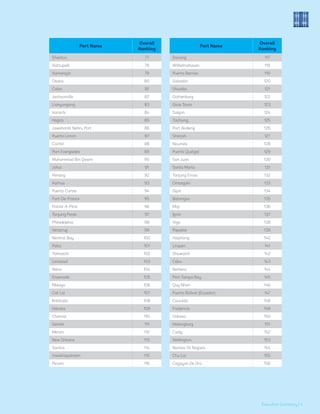
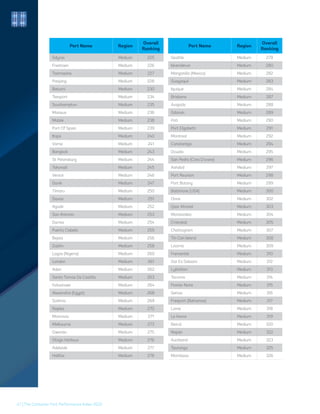
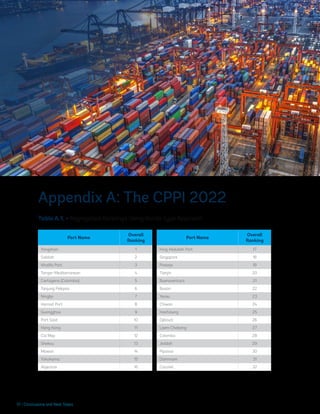
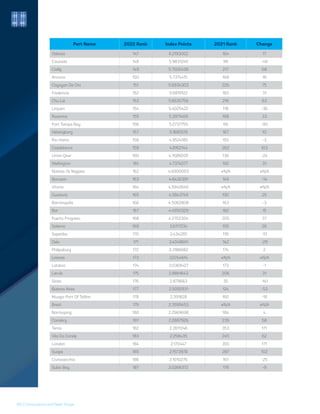
- 11. Port Name Overall Ranking Yangshan 1 Salalah 2 Khalifa Port 3 Tanger-Mediterranean 4 Cartagena (Colombia) 5 Tanjung Pelepas 6 Ningbo 7 Hamad Port 8 Guangzhou 9 Port Said 10 Hong Kong 11 Cai Mep 12 Shekou 13 Mawan 14 Yokohama 15 Algeciras 16 King Abdullah Port 17 Singapore 18 Posorja 19 Tianjin 20 Buenaventura 21 Busan 22 Yeosu 23 Chiwan 24 Kaohsiung 25 Djibouti 26 Laem Chabang 27 Colombo 28 Jeddah 29 Pipavav 30 Dammam 31 Coronel 32 Xiamen 33 Barcelona 34 Callao 35 Port Klang 36 Incheon 37 Jebel Ali 38 Port Name Overall Ranking Fuzhou 39 Marsaxlokk 40 Yarimca 41 Dalian 42 Lazaro Cardenas 43 Wilmington (USA-N Carolina) 44 Kobe 45 Nagoya 46 Shimizu 47 Mundra 48 Sohar 49 Rio Grande (Brazil) 50 Piraeus 51 Port Of Virginia 52 Yantian 53 Tokyo 54 Altamira 55 Haifa 56 Ambarli 57 Jubail 58 Aqaba 59 Bremerhaven 60 Itapoa 61 Zeebrugge 62 Da Chan Bay Terminal One 63 Krishnapatnam 64 Zhoushan 65 Antwerp 66 Rio De Janeiro 67 Savona-Vado 68 Boston (USA) 69 Keelung 70 Santa Cruz De Tenerife 71 Paranagua 72 Khalifa Bin Salman 73 Siam Seaport 74 Diliskelesi 75 Balboa 76 3 | Executive Summary Table E.1 • The CPPI 2022: Global Ranking of Container Ports
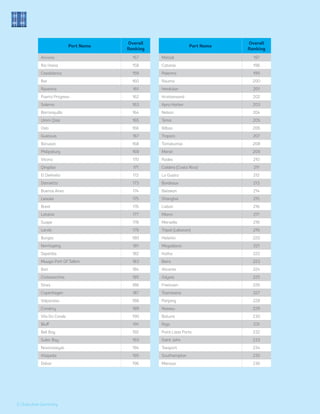
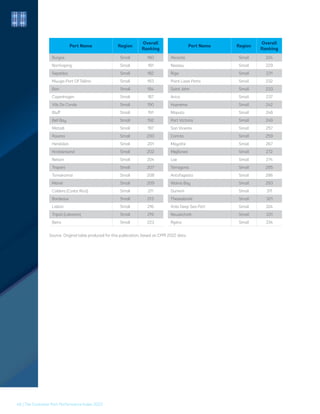
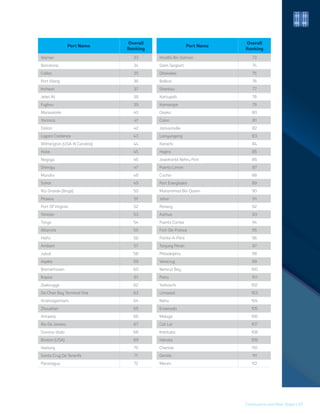
- 12. Executive Summary | 4 Port Name Overall Ranking Shantou 77 Kattupalli 78 Kamarajar 79 Osaka 80 Colon 81 Jacksonville 82 Lianyungang 83 Karachi 84 Hazira 85 Jawaharlal Nehru Port 86 Puerto Limon 87 Cochin 88 Port Everglades 89 Muhammad Bin Qasim 90 Johor 91 Penang 92 Aarhus 93 Puerto Cortes 94 Fort-De-France 95 Pointe-A-Pitre 96 Tanjung Perak 97 Philadelphia 98 Veracruz 99 Nemrut Bay 100 Paita 101 Yokkaichi 102 Limassol 103 Naha 104 Ensenada 105 Malaga 106 Cat Lai 107 Imbituba 108 Hakata 109 Chennai 110 Gemlik 111 Mersin 112 New Orleans 113 Santos 114 Visakhapatnam 115 Pecem 116 Port Name Overall Ranking Danang 117 Wilhelmshaven 118 Puerto Barrios 119 Salvador 120 Shuaiba 121 Gothenburg 122 Gioia Tauro 123 Saigon 124 Taichung 125 Port Akdeniz 126 Sharjah 127 Noumea 128 Puerto Quetzal 129 San Juan 130 Santa Marta 131 Tanjung Emas 132 Omaezaki 133 Gijon 134 Batangas 135 Moji 136 Izmir 137 Vigo 138 Papeete 139 Haiphong 140 Lirquen 141 Shuwaikh 142 Cebu 143 Berbera 144 Port Tampa Bay 145 Quy Nhon 146 Puerto Bolivar (Ecuador) 147 Caucedo 148 Fredericia 149 Odessa 150 Helsingborg 151 Cadiz 152 Wellington 153 Nantes-St Nazaire 154 Chu Lai 155 Cagayan De Oro 156
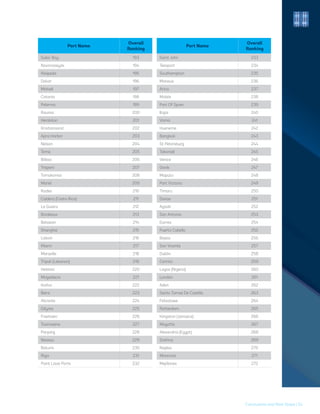
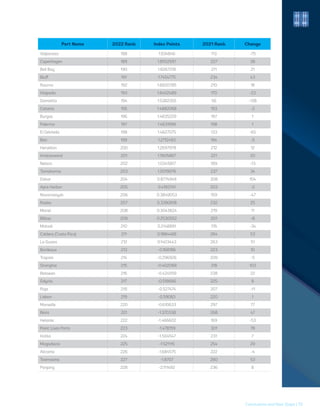
- 13. Port Name Overall Ranking Ancona 157 Rio Haina 158 Casablanca 159 Bar 160 Ravenna 161 Puerto Progreso 162 Salerno 163 Barranquilla 164 Umm Qasr 165 Oslo 166 Gustavia 167 Borusan 168 Philipsburg 169 Vitoria 170 Qingdao 171 El Dekheila 172 Damietta 173 Buenos Aires 174 Leixoes 175 Brest 176 Latakia 177 Suape 178 Larvik 179 Burgas 180 Norrkoping 181 Sepetiba 182 Muuga-Port Of Tallinn 183 Bari 184 Civitavecchia 185 Sines 186 Copenhagen 187 Valparaiso 188 Conakry 189 Vila Do Conde 190 Bluff 191 Bell Bay 192 Subic Bay 193 Novorossiysk 194 Klaipeda 195 Dakar 196 Port Name Overall Ranking Matadi 197 Catania 198 Palermo 199 Rauma 200 Heraklion 201 Kristiansand 202 Apra Harbor 203 Nelson 204 Tema 205 Bilbao 206 Trapani 207 Tomakomai 208 Mariel 209 Rades 210 Caldera (Costa Rica) 211 La Guaira 212 Bordeaux 213 Belawan 214 Shanghai 215 Lisbon 216 Miami 217 Marseille 218 Tripoli (Lebanon) 219 Helsinki 220 Mogadiscio 221 Kotka 222 Beira 223 Alicante 224 Gdynia 225 Freetown 226 Toamasina 227 Panjang 228 Nassau 229 Batumi 230 Riga 231 Point Lisas Ports 232 Saint John 233 Teesport 234 Southampton 235 Manaus 236 5 | Executive Summary
- 14. Executive Summary | 6 Port Name Overall Ranking Arica 237 Mobile 238 Port Of Spain 239 Itajai 240 Varna 241 Hueneme 242 Bangkok 243 St Petersburg 244 Takoradi 245 Venice 246 Gavle 247 Maputo 248 Port Victoria 249 Timaru 250 Davao 251 Agadir 252 San Antonio 253 Durres 254 Puerto Cabello 255 Bejaia 256 San Vicente 257 Dublin 258 Corinto 259 Lagos (Nigeria) 260 London 261 Aden 262 Santo Tomas De Castilla 263 Felixstowe 264 Rotterdam 265 Kingston (Jamaica) 266 Mayotte 267 Alexandria (Egypt) 268 Sokhna 269 Naples 270 Monrovia 271 Mejillones 272 Melbourne 273 Lae 274 Owendo 275 Otago Harbour 276 Port Name Overall Ranking Adelaide 277 Halifax 278 Seattle 279 Iskenderun 280 Tanjung Priok 281 Manzanillo (Mexico) 282 Guayaquil 283 Iquique 284 Tarragona 285 Antofagasta 286 Brisbane 287 Acajutla 288 Gdansk 289 Poti 290 Port Elizabeth 291 Montreal 292 Walvis Bay 293 Constantza 294 Douala 295 San Pedro (Cote D'ivoire) 296 Ashdod 297 Port Reunion 298 Port Botany 299 Baltimore (USA) 300 Valencia 301 Onne 302 Qasr Ahmed 303 Montevideo 304 Cristobal 305 New York New Jersey 306 Chattogram 307 Tin Can Island 308 Livorno 309 Fremantle 310 Dunkirk 311 Dar Es Salaam 312 Lyttelton 313 Tacoma 314 Pointe-Noire 315 Genoa 316
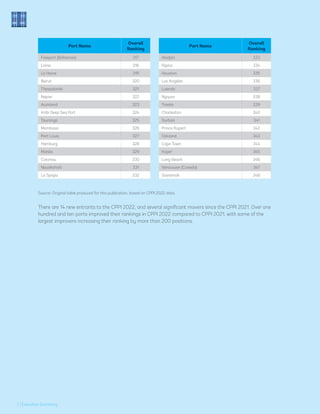
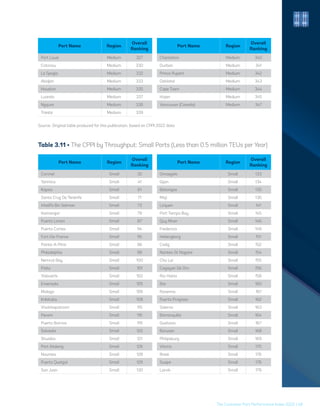
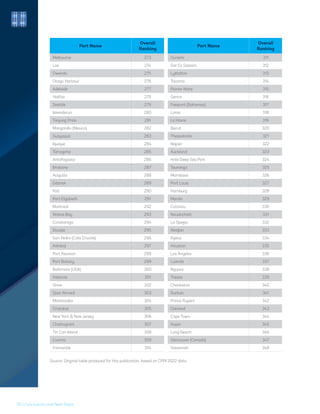
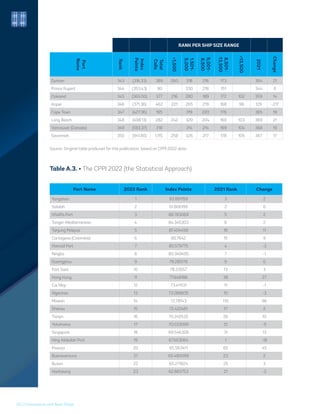
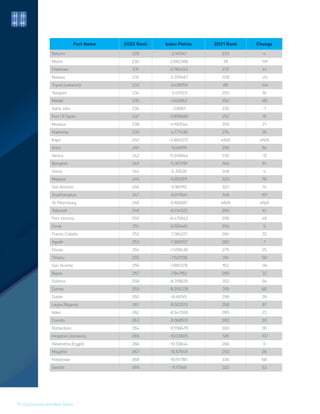
- 15. Port Name Overall Ranking Freeport (Bahamas) 317 Lome 318 Le Havre 319 Beirut 320 Thessaloniki 321 Napier 322 Auckland 323 Kribi Deep Sea Port 324 Tauranga 325 Mombasa 326 Port Louis 327 Hamburg 328 Manila 329 Cotonou 330 Nouakchott 331 La Spezia 332 Source: Original table produced for this publication, based on CPPI 2022 data. There are 14 new entrants to the CPPI 2022, and several significant movers since the CPPI 2021. Over one hundred and ten ports improved their rankings in CPPI 2022 compared to CPPI 2021, with some of the largest improvers increasing their ranking by more than 200 positions. Port Name Overall Ranking Abidjan 333 Rijeka 334 Houston 335 Los Angeles 336 Luanda 337 Ngqura 338 Trieste 339 Charleston 340 Durban 341 Prince Rupert 342 Oakland 343 Cape Town 344 Koper 345 Long Beach 346 Vancouver (Canada) 347 Savannah 348 7 | Executive Summary
- 16. 1. Introduction Since the start of maritime trade, ports have played a central role in the economic and social development of countries. The innovation of containerization by Malcom McLean in 1958 changed the course of the shipping industry and engendered significant changes to where and how goods are manufactured. Container ports remain vital nodes in global supply chains and are crucial to the growth strategies of many emerging economies. The development of high-quality port infrastructure, operated efficiently, has often been a prerequisite for successful growth strategies, particularly those driven by exports. When done correctly, it can attract investment in production and distribution systems and eventually, support the growth of manufacturing and logistics, create employment, and increase income levels. In contrast, a poorly functioning or inefficient port can hinder trade growth, with a profound impact on LLDCs and SIDS. The port, along with the access infrastructure (inland waterways, railways, roads) to the hinterland, is a vital link to the global marketplace and needs to operate efficiently. Efficient performance encompasses several factors, such as the port’s efficiency itself, the availability of sufficient draught, quay, and dock facilities, the quality of road and rail connections, the competitiveness of these services, and the effectiveness of the procedures utilized by public agencies for container clearance. Any inefficiencies or non-tariff barriers among these actors will result in higher costs, reduced competitiveness, and lower trade volumes (Kathuria 2018). More specifically, the efficiency of port infrastructure has been identified as a key contributor to the overall port competitiveness and international trade costs. Micco et al. (2003) identified a link between port efficiency and the cost of international trade. Clark, Dollar, and Micco (2004) found a reduction in country inefficiency, specifically transport cost, from the 25th to 75th percentile, resulting in an increase in bilateral trade of around 25 percent. Wilmsmeier, Hoffmann, and Sanchez (2006) confirmed the impact of port performance 1 Introduction | 8
- 17. 9 | Conclusions and Next Steps on international trade costs, finding that doubling port efficiency in a pair of ports had the same impact on trade costs as halving the physical distance between the ports. Hoffmann, Saeed, and Sødal (2020) analyzed the short- and long-term impacts of liner shipping bilateral connectivity on South Africa’s trade flows, and showed that gross domestic product (GDP), the number of common direct connections, and the level of competition have a positive and significant effect on trade flows. However, ports and terminals, particularly for containers, can often be the main sources of shipment delays, supply chain disruptions, additional costs, and reduced competitiveness. Poorly performing ports are characterized by limited spatial and operating efficiency, maritime and landside access, oversight, and coordination among the public agencies involved, which lower predictability and reliability. The result is that instead of facilitating trade, the port increases the cost of imports and exports, reduces competitiveness, and inhibits economic growth and poverty reduction. The effect on national and regional economies can be severe [see inter alia World Bank (2013)] and has driven numerous efforts to improve performance to strengthen competitiveness. Port performance is also a key consideration for container shipping lines that operate liner services on fixed schedules, based on agreed pro-forma berth windows. Delays at any of the scheduled ports of call on the route served by the vessel would have to be made good before the vessel arrives at the next port of call, to avoid an adverse impact on the efficient operations of the service. As such, port efficiency and port turnaround time at all the ports of call are important subjects for operators, and monitoring port performance has become an increasingly important undertaking in the competitive landscape. One of the major challenges to improving efficiency has been the lack of reliable measures to compare operational performance across different ports. The old management idiom, ‘you cannot manage what you cannot measure,’ is reflective of the historical challenge of both managing and overseeing the sector. While modern ports collect data for performance purposes, it is difficult to benchmark the outcomes against leading ports or ports with similar profiles due to the lack of comparative data. Unsurprisingly, there is a long history of attempts to identify a comparative set of indicators to measure port or terminal performance. A brief review of the literature was provided in The Container Port Performance Index 2020: A Comparable Assessment of Container Port Performance (World Bank 2021), CPPI 2020, which illustrated the broad approaches identified and commented on the merits and demerits of each. The measures fell into three broad categories: Firstly, measures of operational and financial performance; secondly, measures of economic efficiency; and thirdly, measures that rely, predominately, on data from sources exogenous to the port. This review is not replicated in CPPI 2021, and interested readers are directed to CPPI 2020 (World Bank 2021), or the extant literature. One of the general challenges of nearly all the approaches has been the quality, consistency, and availability of data; the standardization of definitions employed; and the capacity and willingness of organizations to collect and transmit the data to a collating body. At a slightly higher level, there are several aggregate indicators that provide an indication of the comparative quality and performance of maritime gateways. The World Bank Logistics Performance Index (LPI) (Arvis et al. 2018) and the World Economic Forum’s Global Competitiveness Index (GCI) 4.0 both report on the perceived efficiency of seaport services and border clearance processes and indicate the extent to which inefficiencies at a nation’s sea borders can impact international trade competitiveness. But the aggregate nature of the indicators, and the fact that they are perception based, means that they offer at best an indication of comparative performance and offer little to guide
- 18. Conclusions and Next Steps | 10 spatial or operating performance improvements at the level of the individual port. The United Nations Conference on Trade and Development’s (UNCTAD’s) Liner Shipping Connectivity Index (LSCI) provides an indicator of a port’s position within the liner shipping network, which is partly a result of the port’s performance, but does not directly measure it. Like the CPPI, the LSCI is limited to container ports. Digitalization offers an opportunity to measure and compare container port performance in a robust and reliable manner. New technologies, increased digitalization and digitization, and growing willingness on the part of industry stakeholders to work collectively toward system-wide improvements have created the capacity and opportunity to measure and compare container port performance. The data used to compile the CPPI 2022 is from SP’s Global Port Performance Program, which commenced in 2009 to drive efficiency improvements in container port operations and supporting programs to optimize port calls. It includes 10 of the world’s largest liner shipping companies, which collectively operate close to 80 percent of the global container ship fleet capacity. The liner shipping companies provide the program with a series of operational time stamps for each individual port call. The data are provided monthly and cover the full global networks of each liner shipping company and their subsidiaries. In 2022, performance time stamp data and other information for the 348 ports comprising the main index were captured for 156,813 port calls involving 243.9 million container moves. The nature, source, and scope of the data are discussed in the subsequent chapter. The aim of CPPI was to utilize the existing empirical data to establish an unbiased metric for comparing container port performance among different ports, over time. The performance of container ports is most relevant in terms of customer experience, specifically the speed and efficiency with which customer assets are handled. In this third edition of CPPI, the focus remains exclusively on quayside performance, which reflects the experience of a container ship operator - the port’s primary customer - and its fundamental value stream. The operational efficiency of how ports receive, and handle container ships is critically important in a carrier’s decision to choose a port over other options. This year, we have streamlined the computation of the CPPI using an additional method that aggregates the two methodologies used in the former editions. This will catalyze and stimulate improvements as the ranking is now more reliable, consistent, and comparable across different ports. The three methodologies employed in this study, and the justification for their use, are presented in the subsequent chapters. The results are presented in chapter 3, with further details provided in appendixes A and B. The purpose of the CPPI is to help identify opportunities to improve a terminal or a port that will ultimately benefit all public and private stakeholders. The CPPI is intended to serve as a benchmark for important stakeholders in the global economy, including national governments, port authorities and operators, development agencies, supranational organizations, various maritime interests, and other public and private stakeholders engaged in trade, logistics, and supply chain services. The joint team from the World Bank and SP Global Market Intelligence intends to enhance the methodology, scope, and data in future annual iterations, reflecting refinement, stakeholder feedback, and improvements in data scope and quality.
- 19. 11 | Conclusions and Next Steps References • Arvis, Jean-François, Lauri Ojala, Christina Wiederer, Ben Shepherd, Anasuya Raj, Karlygash Dairabayeva, and Tuomas Kiiski. 2018. Connecting to Compete 2018: Trade Logistics in the Global Economy. Washington DC: World Bank. https://openknowledge.worldbank.org/bitstream/ handle/10986/29971/LPI2018.pdf. • Clark, Ximena, David Dollar, and Alejandro Micco. 2004. “Port Efficiency, Maritime Transport Costs, and Bilateral Trade.” Journal of Development Economics 75 (2): 417–450. https://doi.org/10.1016/j. jdeveco.2004.06.005. • Hoffmann, Jan, Naima Saeed, and Sigbjørn Sødal. 2020. “Liner Shipping Bilateral Connectivity and Its Impact on South Africa’s Bilateral Trade Flows.” Maritime Economics Logistics 2020, 22 (3): 473–499. DOI: 10.1057/s41278-019-00124-8. • Kathuria, Sanjay. 2018. A Glass Half Full: The Promise of Regional Trade in South Asia. Washington DC: World Bank. https://openknowledge.worldbank.org/handle/10986/30246. • Levinson, Marc. 2006. The Box: How the Shipping Container Made the World Smaller and the World Economy Bigger. Princeton, New Jersey, United States: Princeton University Press. • Micco, Alejandro, Ricardo J. Sanchez, Georgina Pizzolitto, Jan Hoffmann, Gordon Wilmsmeier, and Martin Sgut. 2003. “Port Efficiency and International Trade: Port Efficiency as a Determinant of Maritime Transport Costs.” Maritime Economics Logistics, 5 (2): 199–218. DOI:10.1057/palgrave. mel.9100073. • UNCTAD (United Nations Conference on Trade and Development). 2021. Review of Maritime Transport 2021. Geneva: UNCTAD. https://unctad.org/webflyer/review-maritime-transport-2021. • Wilmsmeier, Gordon, Jan Hoffmann, and Ricardo J. Sanchez. 2006. “The Impact of Port Characteristics on International Maritime Trade Costs.” Research in Transportation Economics, 16 (1): 117–140. DOI:10.1016/S0739-8859(06)16006-0. • World Bank. 2013. “Opening the Gates: How the Port of Dar es Salaam Can Transform Tanzania.” Tanzania Economic Update 3, May 21, 2013. https://www.worldbank.org/en/country/tanzania/ publication/opening-the-gates-how-the-port-of-dar-es-salaam-can-transform-tanzania- backup#:~:text=US%241%2C759%20million%20%E2%80%93%20the%20total,port%20of%20Dar%20 es%20Salaam. • World Bank. 2022. The Container Port Performance Index 2021: A Comparable Assessment of Container Port Performance. Washington, DC: World Bank.
- 20. 2. The Approach and Methodology Introduction Container (liner) shipping services are generally highly structured service rotations. They are typically set up with weekly departure frequencies, a fixed sequence of port calls, and standard pro forma day and time-specific berthing windows. Once a service has been defined or adjusted, it will usually remain intact for many months, or even years. The berthing windows are pre-agreed with the terminal and port operators, usually based on a slightly higher than expected average quantity of container exchange moves, and ideally modest buffers in the sea legs between ports. The clear advantages of this model are that shippers can make long-term supply decisions and ports and terminals schedule and balance their resources to meet expected demand. With a well-planned and well-executed pro forma schedule, they can achieve higher levels of reliability and predictability. This, in turn, can lead to more effective supply chain operations and planning as container ships spend around 15 percent to 20 percent of their total full rotation time in ports, with the balance being spent at sea. Reduced port time can allow ship operators to reduce vessel speed between port calls, thereby conserving fuel, reducing emissions, and lowering costs in the process. Conversely, for every unplanned additional hour in port or at anchorage, the ships need to increase speed to maintain the schedule, resulting in increased fuel consumption, costs, and emissions. In extreme cases, ships that fall many hours behind their pro forma schedule will start to arrive at ports outside of their agreed windows, causing berth availability challenges for ports and terminals, particularly those with high berth utilization rates. This, in turn, causes delay to shipments and disruption to supply chains. A service recovery can involve significantly higher sailing speeds, and therefore, higher fuel consumption, emissions, and costs, or the omission of a port or ports from the service rotation. 2 The Approach and Methodology | 12
- 21. Time is valuable for stakeholders, and so it is logical to measure port performance based on the total amount of time ships are required to spend in port. The CPPI 2022 has been developed based on the total port time in the manner explained in subsequent sections. This iteration has utilized data from the full calendar year of 2022 and has employed the same two approaches as the earlier editions, an administrative approach and a statistical approach. The resulting ranking of container port performance reflects as closely as possible actual port performance, while being statistically robust. The approaches are discussed in this chapter, with further details on the statistical methodology provided in Appendix B. The results are presented in chapter 3, and in more details in Appendix A. The Port Performance Program The data used to compile the CPPI is from SP Global’s Port Performance Program. The program was started in 2009 with the goal of supporting efficiency improvements in container port operations and to support projects to optimize container port calls. The program includes 10 of the world’s largest liner shipping companies that collectively operate close to 80 percent of global fleet capacity. The liner shipping companies provide the program with a series of data points comprising operational time stamps and other bits of information such as move counts for each individual port call undertaken globally. The data are provided monthly and cover the full global networks of each liner shipping company and their subsidiaries. In 2022, performance time stamp data were captured for 157,704 port calls involving 243.9 million container moves at 765 container terminals in 434 ports worldwide. Following receipt from the shipping lines, the port call data undergo several validation and quality checks before mapping to historical AIS vessel movement data, which enables tracking and verification of the shipping line data. The geo-fencing of port and terminal zones within the AIS system supports the creation of several of the performance metrics tracked in the program. Most of the port performance metrics are constructed from the combined AIS and liner shipping data. The combination of empirical shipping line data and AIS movement data enables the construction of more accurate and granular metrics to measure container port performance. Many of the metrics consist of a time component cross-referenced with workload achieved in that time, either in the form of move counts or a specific task within the container port call process. Time stamps, definitions, and methods to calculate metrics are fully standardized in collaboration with the shipping line partners in the program. The Automatic Identification System and Port Zoning AIS technology is used to track and monitor vessels in near real time. It sends information on a vessel’s movement, speed, direction, and other particulars via satellite and terrestrial stations. The system’s function as a localized service, and indeed global tracking, was initially considered secondary. The AIS primarily functions as a navigational safety aid, to ensure the safety and efficiency of navigation, safety of life at sea, and maritime environmental protection.1 AIS was designed for the avoidance of vessel collision, as outlined in the Safety of Life at Sea (SOLAS) Convention.2 All ships of net tonnage of at least 300 gross register tonnage (GRT) performing international voyages, all cargo ships of at least 500 GRT not performing international voyages, and all passenger ships, regardless of size, should be equipped with AIS. This allows vessels to automatically transfer data and a plethora of navigational and identification information to other nearby ships and relevant port authorities in the form of structured messages.3 The technical requirements for AIS are specified by the International Telecommunication Union (ITU) Recommendation ITU-R M.1371-5(02/2014).4 13 | The Approach and Methodology
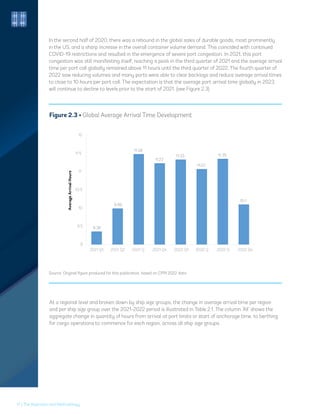
- 22. For maritime domain awareness and safety purposes, the use of continuous 24/7, near-real-time online AIS data makes it possible to monitor areas, vessels, and routes; generate shore-based alerts; and provide useful positional and navigational information in general (IALA 2005). Satellite-based AIS receivers offer coverage outside the land-based antennas’ range by covering the whole globe from pole to pole. Satellite AIS coverage can extend to the entire exclusive economic zone (EEZ) or globally, including remote coastal areas (IALA 2016). In the case of ports5 , the usage of ‘zones’ helps in recording a vessel’s navigational status and positioning. AIS zones offer different indicators activated automatically by the vessel’s signal reporting its position. Every port has at least one zone created in a way that captures the arrivals and sailings of vessels at cargo-handling facilities but avoids spurious reports being recorded from passing traffic. Where a subject port is geographically spread out with terminals located remotely, it is likely that there will be more than one zone, with all zones linked by a standard port identification number. Ports that straddle a river or another similar body of water will often have zones along opposing shorelines with a track separating them, thus avoiding the capture of AIS reports from traffic navigating through a fairway or channel. Once again, the individual zones will be linked to their common port using the port’s unique identification number. Zones also cover anchorages to record vessels arriving at a port but awaiting authority to enter, or vessels laid up awaiting orders. Additional zones cover the arrival of vessels at repair yards or those navigating locks. Anchorage zones may be created on an ad hoc basis. Not all ports have anchorage areas and among those that do, not all are shown in nautical charts. Whenever possible, SP Global uses its own tracking and observation tools to determine where vessels anchor and create zones accordingly. Each anchorage zone is linked to the relevant port using the subject port’s unique identification number. AIS is generally reliable, but it also has limitations that can impact the transmission and quality of the data captured. Some factors that may affect the signal could be the AIS transponder being turned off deliberately, problematic reception, high traffic density areas, weather conditions, or anomalous positions. The Anatomy of a Port Call Every container ship port call can be broken down into six distinct steps. These individual steps are illustrated in Figure 2.1. ‘Total port hours’ is defined as the total time elapsed between when a ship reaches a port (either port limits, pilot station, or anchorage zone, whichever event occurs first) to when it departs from the berth after having completed its cargo exchange. The time spent from berth departure (All Lines Up) to the departure from the port limits is excluded. This is because any port performance loss that pertains to departure delays, such as pilot or tug availability, readiness of the mooring gang, channel access and water depths, forecasting completion time, communication, and ship readiness will be incurred while the ship is still alongside the berth. Additional time resulting from these causes will, therefore, be captured during the period between 4. Last Lift and 5. All Lines Up (“berth departure). The Approach and Methodology | 14
- 23. Figure 2.1 • The Anatomy of a Port Call Source: Original figure produced for this publication Ships may spend extra time in a port after the departure from a berth, but the time associated with these additional activities is excluded from the CPPI, as they are not influenced by the operational performance of the terminal or port. Ships may dwell within a port’s limits for bunkering, repairs, or simply waiting in a safe area if they are unable to berth on arrival at their next port. Apart from bunkering being performed simultaneously with cargo operations, these causes of additional port time are not necessarily reflective of poor performance and hence, are excluded from the CPPI. Although none of these factors necessarily indicate port inefficiency, they can contribute to additional time spent in the port. For instance, clearance authorities’ delays can result in delays in the first lift and idle time after cargo operations have concluded. However, the data available do not provide enough detail to identify the root causes of such delays. It is assumed that only a small percentage of ships idle at the berth after cargo operations due to factors unrelated to port performance, and their inclusion does not significantly affect the CPPI rankings. The other four components of the port call can logically be grouped into two distinct blocks of time. The first comprises elapsed time between Arrival Port Limits and All Lines Fast (steps 1 and 2 in Figure 2.1); the second comprises time elapsed between All Lines Fast and All Lines Up (steps 2 to 5, also commonly referred to as ‘berth time’ or ‘berth hours’). The logic behind this division is that while there will always need to be time consumed between steps 2 and 5, the bulk of time between steps 1 and 2, excluding actual sailing in time, is waiting time, which can be eliminated. 15 | The Approach and Methodology 1 2 POINTS OF ACTIVITY 6 5 3 4 1 2 3 1 1 2 2 4 5 6 3 3 4 4 5 5 6 6 Arrival Port Limits All Lines Fast First Lift Last Lift All Lines Up Exit Port Limits Steam out Arrival At Anchorage and Waiting Time at Anchorage (Berth, Channel, Pilot etc.) Steam in Time Port Limit to All Lines Fast Gangway down, authority clearence, abour available, position crenes, unlash, load approval, etc All cargo operations, driven by Crane Intesity and Gross Crane Performance Lashing and checks, authority clearence, crew onboard, engine ready, repairs completed, bunkers, channel clear, tugs pilot
- 24. Overall Port Time Distribution The time stamps in the source data allow us to break down and summarize total port time into three categories: Arrival Time, Berth Idle, and Cargo Operations. Expressed as a percentage of total port hours recorded, the distribution of port time per ship size range and globally aggregated is shown in Figure 2.2. Figure 2.2 • In-Port Time Consumption Source: Original figure produced for this publication, based on CPPI 2022 data As there is naturally some correlation between ship size and call size, a higher percentage of time is required for cargo operations for the larger ships, and this will be explored in detail later in this report. What is interesting, and surprising at the same time is that only 60 percent of the total port time is attributable to cargo operations, meaning there is potentially a lot of ‘wastage’ in terms of excess time in the system. The average duration of a port call in 2022 was 36.8 hours, which was a slight increase over the global average of 36.3 hours in 2021. About 10.8 percent (or 3.96 hours) was consumed at the berth immediately before and after cargo operations. Also known as the ‘Start-Up’ and ‘Finish’ sub-processes of a port call, each activity does not necessarily need to take more than 30 minutes to complete safely. There are 33,787 examples of Start-Up recorded as 30 minutes or less and a further 29,367 actual cases of the Finish consuming 30 minutes or less. There were 12,784 port calls in 2022 where both the Start-Up and Finish took 30 minutes or less. There is, therefore, an opportunity to eliminate almost three hours per call of port time globally simply through better planning, preparation, communication, and process streamlining. This time saved equates to more hours at sea, leading to slower sailing speeds, lower GHG emissions, and cost savings for the ship operator, which would be significant for each port call. The Approach and Methodology | 16 36.8 32.3 31.5 26.1 20.9 29.7 11.5 10.9 10.6 9.6 7.7 10.7 51.7 56.8 57.9 64.3 71.4 59.6 0% 20% 40% 60% 80% 100% 1,50 Cargo Operations Berth Idle Arrival Time Ship Size Range (nominal TEU) 1,501-5,000 5,001-8,500 8,501-13,500 13,500 Overall
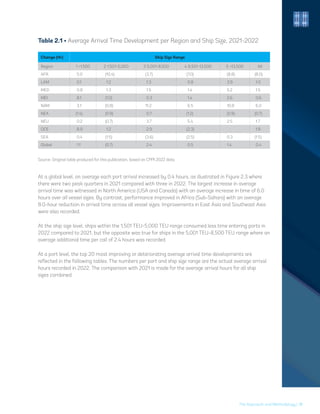
- 25. In the second half of 2020, there was a rebound in the global sales of durable goods, most prominently in the US, and a sharp increase in the overall container volume demand. This coincided with continued COVID-19 restrictions and resulted in the emergence of severe port congestion. In 2021, this port congestion was still manifesting itself, reaching a peak in the third quarter of 2021 and the average arrival time per port call globally remained above 11 hours until the third quarter of 2022. The fourth quarter of 2022 saw reducing volumes and many ports were able to clear backlogs and reduce average arrival times to close to 10 hours per port call. The expectation is that the average port arrival time globally in 2023 will continue to decline to levels prior to the start of 2021. (see Figure 2.3) Figure 2.3 • Global Average Arrival Time Development Source: Original figure produced for this publication, based on CPPI 2022 data Average Arrival Hours 9.36 9.99 11.48 11.23 11.33 11.07 11.35 10.1 9 9.5 10 10.5 11 11.5 12 2021 Q1 2021 Q2 2021 Q 2021 Q4 2022 Q1 2022 Q 2022 Q 2022 Q4 At a regional level and broken down by ship size groups, the change in average arrival time per region and per ship size group over the 2021-2022 period is illustrated in Table 2.1. The column ‘All’ shows the aggregate change in quantity of hours from arrival at port limits or start of anchorage time, to berthing for cargo operations to commence for each region, across all ship size groups. 17 | The Approach and Methodology
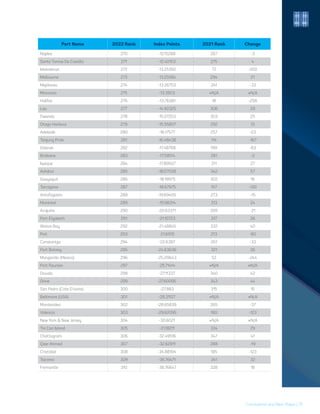
- 26. Table 2.1 • Average Arrival Time Development per Region and Ship Size, 2021-2022 The Approach and Methodology | 18 Change (Hr) Ship Size Range Region 1 1,500 2 1,501-5,000 3 5,001-8,500 4 8,501-13,500 5 13,500 All AFR 5.0 (10.4) (3.7) (7.0) (8.8) (8.0) LAM 0.1 1.2 1.3 0.8 3.9 1.0 MED 0.8 1.3 1.5 1.4 5.2 1.5 MEI 8.1 (1.0) 0.3 1.4 2.6 0.6 NAM 3.1 (0.8) 11.2 6.5 10.8 6.0 NEA (1.4) (0.9) 0.7 (1.2) (0.9) (0.7) NEU 0.2 (0.7) 3.7 5.4 2.5 1.7 OCE 8.9 1.2 2.9 (2.3) 1.8 SEA 0.4 (1.5) (3.6) (2.5) 0.3 (1.5) Global 1.1 (0.7) 2.4 0.5 1.4 0.4 Source: Original table produced for this publication, based on CPPI 2022 data. At a global level, on average each port arrival increased by 0.4 hours, as illustrated in Figure 2.3 where there were two peak quarters in 2021 compared with three in 2022. The largest increase in average arrival time was witnessed in North America (USA and Canada) with an average increase in time of 6.0 hours over all vessel sizes. By contrast, performance improved in Africa (Sub-Sahara) with an average 8.0-hour reduction in arrival time across all vessel sizes. Improvements in East Asia and Southeast Asia were also recorded. At the ship size level, ships within the 1,501 TEU-5,000 TEU range consumed less time entering ports in 2022 compared to 2021, but the opposite was true for ships in the 5,001 TEU-8,500 TEU range where an average additional time per call of 2.4 hours was recorded. At a port level, the top 20 most improving or deteriorating average arrival time developments are reflected in the following tables. The numbers per port and ship size range are the actual average arrival hours recorded in 2022. The comparison with 2021 is made for the average arrival hours for all ship sizes combined.
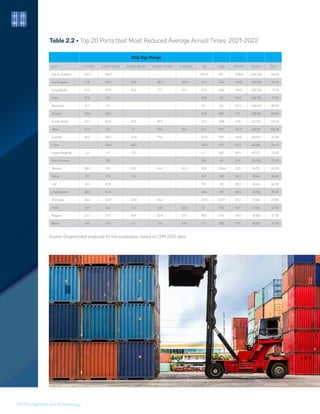
- 27. Table 2.2 • Top 20 Ports that Most Reduced Average Arrival Times, 2021-2022 Ship Size Range Port 1 1,500 2 1,501-5,000 3 5,001-8,500 4 8,501-13,500 5 13,500 All Calls 2021FY Ch Hrs Ch % Dar Es Salaam 42.3 104.7 104.3 151 239.6 (135.30) -56.5% Los Angeles 2.8 20.2 22.6 26.2 36.5 24.7 634 119.3 (94.55) -79.3% Long Beach 21.3 117.2 13.3 17.7 18.1 27.0 282 119.3 (92.30) -77.4% Aden 15.2 13.1 13.8 26 60.6 (46.79) -77.2% Monrovia 6.7 7.2 7.0 26 53.4 (46.40) -87.0% Douala 35.6 38.2 37.9 189 77.1 (39.19) -50.9% Pointe-Noire 22.1 24.0 31.2 16.0 24.1 388 51.8 (27.70) -53.4% Tema 13.3 9.3 7.1 12.0 19.1 9.3 587 30.2 (20.91) -69.3% Luanda 18.5 29.3 44.8 71.9 32.9 291 49.8 (16.97) -34.0% Lome 28.0 46.2 30.9 175 43.7 (12.85) -29.4% Lagos (Nigeria) 3.2 4.7 7.0 4.7 192 16.9 (12.17) -72.0% Port Victoria 8.9 8.9 45 21.0 (12.08) -57.6% Yantian 38.5 10.1 11.5 14.4 10.3 11.8 2,954 21.5 (9.71) -45.2% Dakar 31.7 17.8 8.9 16.7 398 26.3 (9.64) -36.6% LAE 9.5 12.8 11.0 28 20.5 (9.44) -46.2% Chattogram 36.0 52.3 49.4 212 58.4 (8.95) -15.3% Shanghai 24.4 23.9 23.8 24.4 23.9 2,371 31.3 (7.46) -23.8% Haifa 9.6 6.4 5.3 2.8 12.0 7.7 734 14.7 (7.01) -47.6% Ngqura 37.2 21.7 18.4 12.9 2.9 18.2 213 25.0 (6.83) -27.3% Beirut 9.5 6.9 4.1 3.6 2.8 7.2 382 13.7 (6.53) -47.5% Source: Original table produced for this publication, based on CPPI 2022 data. 19 | The Approach and Methodology
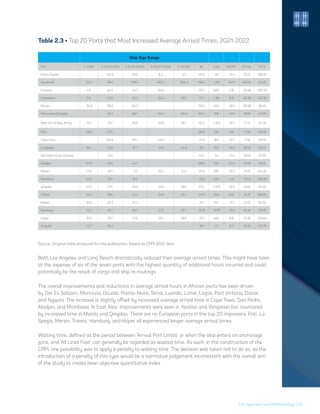
- 28. Table 2.3 • Top 20 Ports that Most Increased Average Arrival Times, 2021-2022 Ship Size Range Port 1 1,500 2 1,501-5,000 3 5,001-8,500 4 8,501-13,500 5 13,500 All Calls 2021FY Ch Hrs Ch % Prince Rupert 124.6 95.0 8.3 2.1 65.6 90 13.4 52.17 389.1% Savannah 25.3 96.1 105.2 165.5 206.3 130.4 1,115 45.11 85.03 52.9% Houston 4.0 20.5 44.7 93.0 39.3 800 2.8 36.58 1327.3% Charleston 5.6 21.9 35.3 54.2 58.1 37.3 1,161 6.9 30.38 437.3% Manila 76.8 58.2 62.3 59.0 612 30.1 28.98 96.4% Vancouver (Canada) 35.3 66.1 64.2 124.2 60.7 318 41.6 19.10 45.9% New York New Jersey 12.1 31.2 26.6 40.8 18.2 30.3 1,382 12.5 17.72 141.3% Poti 26.9 27.5 26.9 69 9.6 17.30 179.3% Cape Town 60.0 111.7 48.3 74.9 185 57.7 17.16 29.7% La Spezia 16.4 31.9 15.7 14.9 44.8 31.1 159 14.6 16.53 113.4% San Pedro (Cote D'ivoire) 43.1 43.1 54 27.4 15.69 57.2% Abidjan 117.9 78.5 44.7 69.0 292 53.4 15.59 29.2% Mersin 31.8 28.1 7.6 16.2 8.4 25.6 885 10.5 15.15 144.3% Mombasa 24.8 19.2 18.2 19.8 254 4.6 15.13 325.9% Qingdao 33.3 27.5 29.0 33.0 18.6 27.4 2,705 12.8 14.64 114.5% Trieste 16.8 18.6 32.2 22.8 37.4 22.9 353 8.6 14.31 166.6% Napier 61.9 26.5 35.4 31.1 144 17.1 14.07 82.4% Hamburg 12.0 16.7 26.1 27.2 35.7 22.8 1,670 10.5 12.32 117.0% Koper 15.5 18.1 77.0 20.1 39.0 21.1 462 8.8 12.30 139.6% Acajutla 53.7 18.3 19.1 43 8.2 10.92 133.7% Source: Original table produced for this publication, based on CPPI 2022 data. Both Los Angeles and Long Beach dramatically reduced their average arrival times. This might have been at the expense of six of the seven ports with the highest quantity of additional hours incurred and could potentially be the result of cargo and ship re-routings. The overall improvements and reductions in average arrival hours in African ports has been driven by Dar Es Salaam, Monrovia, Douala, Pointe-Noire, Tema, Luanda, Lomé, Lagos, Port Victoria, Dakar, and Ngqura. The increase is slightly offset by increased average arrival time in Cape Town, San Pedro, Abidjan, and Mombasa. In East Asia, improvements were seen in Yantian and Yangshan but countered by increased time in Manila and Qingdao. There are no European ports in the top 20 improvers. Poti, La Spezia, Mersin, Trieste, Hamburg, and Koper all experienced longer average arrival times. Waiting time, defined as the period between ‘Arrival Port Limits’ or when the ship enters an anchorage zone, and ‘All Lines Fast’ can generally be regarded as wasted time. As such, in the construction of the CPPI, one possibility was to apply a penalty to waiting time. The decision was taken not to do so, as the introduction of a penalty of this type would be a normative judgement inconsistent with the overall aim of the study to create bean objective quantitative index. The Approach and Methodology | 20
- 29. There was consideration as to whether to apply a discount to waiting time for the smallest segment of ships. Smaller ships generally suffer less priority than larger ones, and in some hub ports might be purposely idled at anchorage waiting to load cargo which is arriving from off-schedule ocean going ships. However, after reviewing average arrival time for the various ship size segments on a regional basis, the data did not support applying a discount to waiting time for the smallest segment of ships. (see Table 2.4). Table 2.4 • Average Arrival Time Performance per Ship Size Range per Region 2022 Ship Size Range Region 1,500 1,501-5,000 5,001-8,500 8,501-13,500 13,500 Average AFR 27.8 27.6 32.9 20.0 13.7 27.8 LAM 8.0 7.3 8.7 7.7 10.5 7.7 MED 9.7 8.3 7.1 7.3 11.1 8.7 MEI 13.6 7.4 5.7 6.7 7.2 7.2 NAM 9.2 17.3 31.7 43.7 54.2 30.8 NEA 6.3 8.2 8.4 7.1 6.1 7.6 NEU 8.8 8.0 13.5 15.0 16.9 11.7 OCE 17.4 14.3 14.2 8.6 13.9 SEA 10.2 10.2 6.5 6.2 4.3 8.7 Average 10.1 10.2 12.9 11.6 10.6 10.9 Source: Original table produced for this publication, based on CPPI 2022 data. Regions that host major hub ports, and where smaller sized ships expended more time to arrive than the average of all ships, are the Mediterranean, the Middle East, India, and Southeast Asia. Further study reveals that the following hub ports in these regions did record significantly higher average arrival times for smaller ships versus the average for all vessel sizes. Table 2.5 • Smaller Vessel Average Arrival Times Port Arrival Hours (ships 1,500 TEU) Arrival Hours (ships 1,500 TEU Additional Arrival Hours (as a percentage) Original Overall Rank Overall Rank after Simulation Jeddah 40.2 8.8 + 357.6% 28 27 King Abdullah 7.8 3.9 + 101.4% 16 16 Khalifa Port 9.3 5.5 + 68.6% 3 4 Singapore 10.4 6.3 + 63.9% 19 20 Marsaxlokk 15.5 9.6 + 61.3% 42 43 Tanger-Mediterranean 9.7 6.3 + 54.4% 5 6 Source: Original table produced for this publication, based on CPPI 2022 data. 21 | The Approach and Methodology
- 30. To test the significance of purposely delayed smaller feeder vessels on the overall ranking, we conducted a simulation within the overall CPPI model. For all ports (not only the focus ports), we reduced the quantity of arrival hours by 50 percent for all ship calls where the capacity of the ship is 1,500 TEU or less in size. The quantity of berth hours for all ships was maintained at 100 percent, as was the average arrival hours for all other ship size groups. Table 2.5 displays the original overall rank without any adjustment to feeder ship arrival hours. The last column presents what the overall rank would have been with 50 percent of arrival hours for ships of 1,500 TEU or less capacity eliminated. The conclusion from the simulation is that such an adjustment does not materially alter the overall CPPI 2022 rankings, and four of the six focus ports dropped in rankings during the simulation (Khalifa Port, Singapore, Marsaxlokk, and Tanger-Mediterranean), although only by one place. Since it is not possible to see from the data whether waiting time is voluntary or forced, it is difficult to find a suitable level at which to discount waiting time in this scenario. The port calls of ships with less than 1,500 TEUs of capacity comprise just 10 percent of the total calls in the CPPI. Therefore, the disparity in waiting times between ships with less than 1,500 TEUs of nominal capacity and other segments, as simulated, has only a small impact to the overall CPPI. To keep the data pure and avoid normative judgment that is inconsistent with an objective quantitative index, the rankings published in this iteration are not influenced by adjustments made to empirically recorded port hours. The Significance of Call Size As illustrated in Figure 2.2, over 60 percent of a port call is consumed through cargo operations, for the handling of containers. In this aspect of the call, call size is of great significance. Call size is far less significant when it comes to arrival time, which is more likely to be influenced by ship size. There have been several earlier studies, in which ships are grouped into size segments (ranges) based upon their size or capacity and port calls are ranked based on the time elapsed in port or on the berth. While these studies provide an indication, the optimum outcome requires the workload for each call to be taken into consideration. In this index, workload is represented by ‘Call Size,’ defined as the total quantity of containers (regardless of size), which were physically discharged, loaded, or restowed during a port call. The Approach and Methodology | 22
- 31. Figure 2.4 • The Aggregated Correlation between Ship and Call Size Average Call Size 0 2,000 4,000 6,000 8,000 10,000 12,000 14,000 16,000 18,000 20,000 0 500 1,000 1,500 2,000 2,500 3,000 3,500 4,000 1,500 1,501-5,000 5,001-8,500 8,501-13,500 13,500 Call Size Ship Size Ship Size Range (nominal TEU) Average Ship Size (TEU capacity) Source: Original figure produced for this publication, based on CPPI 2022 data Although there will be some level of correlation between the ship and call size, it is not a perfect correlation. For example, an 18,000 TEU capacity ship calling at a port in Thailand or southern Vietnam might exchange 1,000-2,000 containers per call, but that same ship in Yangshan or Singapore might exchange more than 4,000 containers. Similarly, in the Thai or southern Vietnamese ports, a 3,000 TEU (‘feeder’ ship) might exchange more than 3,000 containers, potentially twice that of an 18,000 TEU mainline ship at the same port. The 60 percent of a port call, during which containers are exchanged, is influenced by two sub-factors: 1. The quantity of cranes deployed 2. The speed at which the cranes, especially the long crane (the crane with the highest workload in terms of cycles), operate 23 | The Approach and Methodology
- 32. Gross Cranne Moves per hr per Ship Size range 21.3 23.0 23.6 24.3 23.7 19.5 20.5 21.5 22.5 23.5 24.5 1,500 1,501-5,000 5,001-8,500 8,501-13,500 13,500 Ship Size Range Figure 2.5 • Container Moves Performed per gross Crane Hour across Various Ship Sizes Source: Original figure produced for this publication, based on CPPI 2022 data The variation in containers handled per gross crane hour across all ship sizes is statistically minor. The global average for all ships is 23.5 moves per hour, so the smallest ships are 9.4 percent less efficient than the average, whereas ships in the 8,501 TEU-13,500 TEU range are 3.6 percent more efficient than the average. It is often implied that larger ships are more difficult to work, but the data says otherwise. On the larger ships, the crane operator has higher hoists and longer trolley distances, which increases cycle time, but this is offset by more moves per bay and hatch, resulting in more containers handled per gantry or hatch-cover move. The smaller ships can often encounter list or trim issues, making it harder for the operator to hit the cell-guides and the hatch-cover and lashing systems. The Approach and Methodology | 24
- 33. Groos Crane Productivity 23.3 22.4 22.2 22.9 23.5 23.9 24.4 24.3 24.2 23.2 21.0 21.5 22.0 22.5 23.0 23.5 24.0 24.5 25.0 Call Size 2 5 0 2 5 1 - 5 0 0 5 0 1 - 1 , 0 0 0 1 , 0 0 1 - 1 , 5 0 0 1 , 5 0 1 - 2 , 0 0 0 2 , 0 0 1 - 2 , 5 0 0 2 , 5 0 1 - 3 , 0 0 0 3 , 0 0 1 - 4 , 0 0 0 4 , 0 0 1 - 6 , 0 0 0 6 , 0 0 0 Figure 2.6 • Gross Crane Productivity by Call Size Figure 2.7 • Crane Productivity by Crane Intensity Source: Original figure produced for this publication, based on CPPI 2022 data Source: Original figure produced for this publication, based on CPPI 2022 data Moves per Gross Crane Hour 30.7 22.5 22.6 23.1 23.7 24.0 23.2 21.8 18.0 17.0 19.0 21.0 23.0 25.0 27.0 29.0 31.0 1 2 3 4 5 6 7 8 9 Rounded Crane Intensity 25 | The Approach and Methodology
- 34. A review of gross crane productivity versus call size and crane intensity reveals no strong increases or decreases through the ranges. Assessed on call size ranges, there is a -5.2 percent to 3.8 percent variation to the average. Meanwhile, an assessment of crane intensity reveals that the first and last segments have extremely high and low performances, respectively, but in the mid-range, there is little difference in crane productivity across the seven ranges. This implies that crane speed (productivity) does not gradually increase (or decrease) as ship size, call size, or crane intensity increases. It is therefore statistically not a key determinant of operating hours. The far more significant influencer of operating time is the quantity of cranes deployed (crane intensity). Figure 2.8 • Call Size versus Crane Intensity Figure 2.9 • Average Moves per Crane Crane Intensity Call Size Range 1.5 1.8 2.3 2.9 3.3 3.7 4 4.3 5 4.7 1.0 1.5 2.0 2.5 3.0 3.5 4.0 4.5 5.0 5.5 2 5 0 2 5 1 - 5 0 0 5 0 1 - 1 , 0 0 0 1 , 0 0 1 - 1 , 5 0 0 1 , 5 0 1 - 2 , 0 0 0 2 , 0 0 1 - 2 , 5 0 0 2 , 5 0 1 - 3 , 0 0 0 3 , 0 0 1 - 4 , 0 0 0 4 , 0 0 1 - 6 , 0 0 0 6 , 0 0 0 Source: Original figure produced for this publication, based on CPPI 2022 data Source: Original figure produced for this publication, based on CPPI 2022 data Container Moves per Quay Crane 123 2 5 0 2 5 1 - 5 0 0 5 0 1 - 1 , 0 0 0 1 , 0 0 1 - 1 , 5 0 0 1 , 5 0 1 - 2 , 0 0 0 2 , 0 0 1 - 2 , 5 0 0 2 , 5 0 1 - 3 , 0 0 0 3 , 0 0 1 - 4 , 0 0 0 4 , 0 0 1 - 6 , 0 0 0 6 , 0 0 0 A v e r a g e 211 321 430 524 607 689 791 960 1,691 451 0 200 400 600 800 1000 1200 1400 1600 1800 Call Size Range The Approach and Methodology | 26
- 35. As might be expected, the more container moves are to be handled, the more cranes must be deployed. However, crane intensity lags call size growth, which means that as the call size grows, each crane is required to handle more containers. Theoretically, if a call with 1,000 moves was assigned 2 cranes, then one with 5,000 moves would require 10 cranes for a status quo, and that does not happen often, if at all. Since the exchange rate per crane does not increase progressively with ship size, call size, or crane intensity growth, the overall operating time increases. This makes call size differentiation the critical factor to consider when attempting port performance benchmarking and ranking. Construction of the CPPI Moving on to the construction of the CPPI, for a port to qualify for inclusion in the CPPI it must have registered at least 24 valid port calls where port hours can be calculated within the full calendar year. Of the 434 ports for which SP Global received port call information, 348 are included in the main index of CPPI 2022. There were 156,813 distinct port calls recorded in the data over the period at those 348 main ports. A further 86 ports registered less than 24 calls each, accumulatively accounting for 891 port calls (0.6 percent of the total), these ports are excluded from the CPPI 2022. The CPPI is based solely on the average port hours per port call, with port hours being the total time elapsed from when a ship first entered a port to when it departed from the berth. Due to the large volume of data, it was possible and prudent to break it down into ship size and call size groups or ranges. However, too much fragmentation would have diluted the data to the extent that more assumptions than actual empirical data would be present in the index. Therefore, the data was grouped into five distinct ship sizes, and then within each ship size group by call size group, as reflected in Figure 2.10 below. Source: Original figure produced for this publication Figure 2.10 • The Structure of the CPPI 250 moves 251-500 moves 1,001-1,500 moves 1,501-2,000 moves 2,001-2,500 moves 4,001-6,000 moves 6,000 moves 2,501-3,000 moves 501-1,000 moves 3,001-4,000 moves 1,500 TEU 1,501-5,000 TEU 8,501- 13,500 TEU 13,500 TEU 5,001-8,500 TEU Container Port Performance index X Ship size Groups Call size Groups 27 | The Approach and Methodology
- 36. The number of ship size groups was limited to five, and the number of call size groups to 10. That results in a 50 (5 x 10) matrix for the qualifying ports for the main index of CPPI 2022. However, there were insufficient port calls in the larger five call size groups for the less than 1,500 TEU ship size group and similarly for the two larger call size groups for the 1,501 TEU-5,000 TEU ship size group. In total, the data was distributed into 43 ship-call size groups. Table 2.6 • Port Calls Distribution Call Size Group Ship Size Group 250 251- 500 501- 1000 1001- 1500 1501- 2000 2001- 2500 2501- 3000 3001- 4000 4001- 6000 6000 1 1,500 20.5% 37.2% 36.9% 5.0% 0.2% 0.1% 0.0% 0.0% 0.0% 0.0% 2 1,501-5,000 6.1% 20.1% 36.0% 20.1% 9.9% 4.7% 1.8% 1.1% 0.2% 0.0% 3 5,001-8,500 1.3% 6.5% 20.9% 23.1% 18.6% 12.0% 7.2% 6.8% 2.9% 0.6% 4 8,501-13,500 0.8% 4.0% 13.8% 16.7% 15.0% 13.7% 10.9% 13.4% 8.4% 3.3% 5 13,500 0.2% 0.9% 4.6% 7.1% 8.7% 9.6% 9.5% 18.8% 26.5% 14.1% Source: Original table produced for this publication, based on CPPI 2022 data. The five ship size groups were based on where they might be deployed and the similarities of ships within each group. Although a sixth group for ships more than 18,000 TEU or 24,000 TEU could have been added, it would have highly diluted the data in the two larger ship size groups. Table 2.7 • Ship Size Group Definitions Nominal TEU Capacity Range Description Less than 1,500 Almost exclusively feeder vessels, often connecting small outlying ports with regional hub ports. Some intra-regional services will also have ships in this size range. 1,500 to 5,000 A vast quantity of these classic Panamax ships are deployed on intra-regional trades. They are found on North-South trades to and from Africa, Latin America, and Oceania, as well as Transatlantic services. 5,000 to 8,500 Vessels within this size group are mainly deployed on the North-South trade lanes. Vessel cascading and improving port capabilities has seen them start to emerge as stock vessels for Africa, Latin America, and Oceania trades. There is some presence on Transatlantic and Asia–Middle East trades as well. 8,500 to 13,500 These Neo-Panamax vessels are largely deployed on East-West trades, particularly Trans-Pacific, both to North America’s west coast as well as via either the Panama or Suez Canals to North America’s east coast. They also feature on Asia–Middle East trades, with some deployed on Asia–Mediterranean rotations. Greater than 13,500 These ultra-large container ships (ULCS) are mainly deployed on Asia–Europe (serving both North Europe and the Mediterranean) and Asia–United States trades, especially on Trans-Pacific services calling at North America’s west coast ports. Source: Original table produced for this publication, based on CPPI 2022 data. The application of ship size groups is less important than call size groups, particularly since the call data is already split into 10 call size groups. However, the objective of the CPPI is to highlight through comparison the performance gaps and opportunities to save fuel and reduce emissions. The analysis should, therefore, consider that the larger the ship, the more fuel it consumes, and the higher the potential to save fuel and reduce emissions. The Approach and Methodology | 28
- 37. Figure 2.11 • Percentage of Port Calls per Ship Size Group - 2022 Source: Original figure produced for this publication, based on CPPI 2022 data Almost 50 percent of all ship port calls in 2022 were from the Panamax (1,501-5,000 TEU) size of ships. With just 10 percent of port calls made by ships more than 13,500 TEU, it was decided not to disaggregate these further. As the main participants of the Port Performance Program are primarily deep-sea operators, there was a relatively small number of calls in the feeder segment (less than 1,500 TEU capacity). An attempt has been made to make the 10 call size groups as narrow as possible by grouping together calls in instances where they are most likely to have received similar crane intensity provisions. The analysis then compares all qualifying ports on how close (or far) the individual call size is to the average call size within each call size group. Table 2.8 • Call Size Sensitivity Call Size Sensitivity Call Size Group 250 251- 500 501- 1000 1001- 1500 1501- 2000 2001- 2500 2501- 3000 3001- 4000 4001- 6000 6000 Average 179 381 736 1,234 1,732 2,228 2,735 3,445 4,785 8,061 Median 188 386 730 1,226 1,725 2,222 2,727 3,420 4,638 7,065 Lower Range 160 328 620 1,042 1,466 1,888 2,318 2,907 3,942 6,005 Upper Range 216 443 839 1,410 1,984 2,555 3,136 3,933 5,334 8,125 Total Ports 290 338 339 289 244 211 183 163 116 65 Within Range 220 318 304 280 244 211 183 162 114 52 Percentage in Range 75.9% 94.1% 89.7% 96.9% 100.0% 100.0% 100.0% 99.4% 98.3% 80.0% Source: Original table produced for this publication, based on CPPI 2022 data 10% 46% 17% 17% 10% 1,500 1,501-5,000 5,001-8,500 8,501-13,500 13,500 29 | The Approach and Methodology
- 38. To assess the sensitivity within each call size group across all 348 qualifying ports, the median call size between all ports within a call size group was taken and a tolerance range of 15 percent above and below the median created (see Table 2. 8). In the six call size groups from the 1,001–1,500 to 4,001–6,000 moves groups, more than 96.9 percent of ports have an average call size well within this tolerance range. Beyond the threshold of 6,000 moves per call, the call size has a much lower impact on crane intensity. This is because the number of cranes that can be deployed is limited by the overall number of cranes available or stowage splits. The quantity of ports with an average call size within the tolerance range in the three smallest call size groups is not as high as the quantity in the six call size groups from the 1,001–1,500 to 4,001–6,000 moves groups. However, for ports with an average call size above the tolerance range, it would be possible to increase crane intensity to match the slightly higher call sizes, and, therefore, the conclusion is that objective comparisons can be made within all 10 call size groups. Imputing Missing Values: the Administrative Approach The handicap of missing values can be addressed in two different ways in the administrative approach and the statistical approach. The former involves assigning values to empty categories based on data that are available when a port has registered a data point within a specific ship size range. Table 2.9 • Quantity of Ports Included per Ship Size Group Ship Size Range Quantity of Ports Included Base Call Size Less than 1,500 TEUs 276 251–500 1,500–5,000 TEUs 330 501–1,000 5,000–8,500 TEUs 220 1,001–1,500 8,500–13,500 TEUs 178 1,501–2,000 More than 13,500 TEUs 105 3,001–4,000 Source: Original table produced for this publication, based on CPPI 2022 data For each ship size group, the call size group that has the largest quantity of data representation is selected (see Table 2.9) as the Base Call Size group. Ideally, this is a mid-range call size group because the lowest and highest groups can demonstrate some uniqueness. In cases where there is no actual data for the base call size group, the next highest group is examined to find an actual data set. If none is found, then the approach involves looking at the immediately lower call size band. At the end of this exercise, every port has a value assigned for the base call size group. Imputing vessel arrival values. Where a call size group does not have an arrival hours value, it is populated using the overall average arrival time for all vessels registered at that port across all call size groups within each specific ship size group. This is logical as call size is a less important determinant of waiting time than ship size. Imputing berth hours. From the base call size group, moving left toward the lowest group and right toward the highest group, in groups where no value exists, a value is determined on a pro rata basis given the adjacent call size group value, actual data or imputed. The rationale is that if within one call size group a port has either higher or lower berth hours than the average, the adjacent call size group too is likely to show similar trends. The Approach and Methodology | 30
- 39. Table 2.10 provides an example. In this case, port A had a higher quantity of hours in the base call size group than the group average. It is assumed that would also have been the case had the port registered actual calls in the 501–1,000 and 1,501–2,000 call size groups. The opposite is true for port B, which achieved a lower quantity of hours in the base call size group. The calculation for port A in the 501–1,000 call size group is actual hours within the group 1,001–1,500 (12.0) multiplied by the group average factor (0.9) for a prorated quantity of average berth hours of (10.8). Table 2.10 • Example of Imputing Missing Values Port Call Size Group 501–1,000 1,001–1,500 1,501–2,000 Port A 10.8 12.0 14.4 Port B 7.2 8.0 9.6 Group Average 9.0 10.0 12.0 Factor Multiplier 0.9 Base 1.2 Source: Original table produced for this publication, based on CPPI 2022 data Note: The numbers in the green highlighted cells have been imputed by multiplying the base cells by the factor multiplier determined by the overall group average. The inherent risk with this approach is that poor or good performance within just one group will cascade across all call size groups. It also assumes that a port can add cranes to larger call size groups, which might not be true in all cases. On the other hand, it would be illogical to assume that any port would simply achieve the average of the entire group or that a port performing below average in one call size group would perform much better than average in others where it did not record any actual calls. Imputing Missing Values: the Statistical Approach A more rigorous approach is used for the statistical approach through the use of a likelihood-based method to impute those missing values. With respect of the current data set, the expectation- maximization (EM) algorithm can be utilized to provide a maximum-likelihood estimator for each missing value. This approach relies on two critical assumptions: The first one is that the missing values are random, that is, it is not due to some bias in the sample selection; and the second one is that the variables under consideration are all normally distributed. These assumptions are not considered unrealistic in the context of the data set. EM then computes the maximum likelihood estimator for the mean and variance of the normal distribution given the observed data. Knowing the distribution that generates the missing data, one can then sample from it to impute the missing values.6 Constructing the CPPI 2022 Index Using a Ranking Aggregation Method The CPPI has in previous iterations utilized two distinct methodologies: the administrative, or technical approach that employs expert knowledge and judgment to produce a practical methodology, and a statistical approach that utilizes factor analysis (FA). CPPI 2022 goes a step further to aggregate the two rankings to produce one index that to present the performance of ports via both methodologies. 31 | The Approach and Methodology
- 40. Borda-type approach for index aggregation Rank aggregation, that is the process of combining multiple rankings into a single ranking, is an important problem arising in many areas (Langville and Meyer 2012). For example, in a ranked voting system, citizens rank candidates in their order of preference and a single winner needs to be determined. Similarly, recommender systems and search engines can produce many different rankings of items that are likely to be of interest to a given user. Such rankings can naturally be aggregated to produce a more robust list of items (Pappa et al. 2020). Many strategies were proposed in the literature to combine several rankings into one that is as consistent as possible with the individual rankings (Langville and Meyer 2012, Fagin et al. 2003, Dwork et al. 2001, Dwork et al. 2012, Oliveira et al. 2020) and references therein. The Borda count (Langville and Meyer 2012, Chapter 14) provides a simple and effective approach for aggregating rankings, wherein each item to rank is given points according to the number of items it outranks in its segment. These points are added and then used to produce a new ranking. Our approach to combine the administrative and the statistical rankings is inspired by the Borda count, but also considers the index values for attributing the number of points. The process is as follows: First, each index is scaled to take values into the interval [0,1]. This is accomplished by applying the following linear transformation: where m is the minimum value of the index and M the maximum value. Observe that the port with the smallest index is always given a scaled value of 0 and the port with largest index a scaled value of 1. The other ports get a scaled value between 0 and 1. Once the indices are scaled, they are added to produce a combined index. Finally, a ranking is obtained by sorting the ports according to the combined index in decreasing order. Thus, the port with the largest combined index is ranked first and the port with the smallest combined index is ranked last. Table 2.11 • An Example of Aggregated Rankings for Four Ports with Randomly Generated Administrative and Statistical Index Values Ports Administrative Index Statistical Index Scaled Administrative Index Scaled Statistical Index Combined Index Final Ranking Port 1 1.45 1.97 1.000 1.000 2.000 1 Port 2 1.26 1.21 0.678 0.392 1.070 3 Port 3 1.23 1.31 0.627 0.472 1.099 2 Port 4 0.86 0.72 0.000 0.000 0.000 4 Source: Original table produced for this publication, based on CPPI 2022 data. For example, the scaled administrative index value of Port 2 (x = 1.26) is computed as follows: the minimum and maximum values of the administrative index are m = 0.86 and M = 1.45. Thus, the scaled value is The Approach and Methodology | 32
- 41. References • Langville, Amy N., and Carl D. Meyer. Who’s# 1?: the Science of Rating and Ranking. Princeton University Press, 2012. • Fagin, Ronald, Ravi Kumar, and Dakshinamurthi Sivakumar. Comparing Top k lists. SIAM Journal on Discrete Mathematics 17, no. 1 (2003): 134-160. • Dwork, Cynthia, Ravi Kumar, Moni Naor, and D. Sivakumar. Rank Aggregation Revisited. (2001): 613-622. • Dwork, Cynthia, Ravi Kumar, Moni Naor, and Dandapani Sivakumar. Rank Aggregation Methods for the Web. In Proceedings of the 10th International Conference on World Wide Web, pp. 613-622. 2001. • Ali, Alnur, and Marina Meilă. Experiments with Kemeny Ranking: What Works When? Mathematical Social Sciences 64, no. 1 (2012): 28-40. • Oliveira, Samuel EL, Victor Diniz, Anisio Lacerda, Luiz Merschmanm, and Gisele L. Pappa. Is Rank Aggregation Effective in Recommender Systems? An Experimental Analysis. ACM Transactions on Intelligent Systems and Technology (TIST) 11, no. 2 (2020): 1-26. 33 | The Approach and Methodology
- 42. 3 3. The Container Port Performance Index 2022 Introduction The rankings of container port performance, based on the ranking aggregation approach, are presented in this chapter. The following section presents the rankings for the top 100 best performing container ports, with the full rankings of all ports by both approaches presented in Appendix A. The subsequent sections present a summary by region and port throughput (large, medium, small), so ports in the same region, or with the same throughput within broad categories, can be easily compared. The CPPI 2022 Table 3.1 presents the rankings of container port performance in the CPPI 2022. It reflects the aggregation of the scores from the results from the administrative approach and the statistical approach in the manner described in the previous section. In the aggregate index, the two top-ranked container ports in the CPPI 2022 are Yangshan Port (China) in first place, followed by the Port of Salalah (Oman) in second place. These two ports occupy the same positions in the rankings generated by the constituent approaches. The Port of Salalah was ranked second in both approaches in CPPI 2021, while the Yangshan Port ranked third and fourth in the statistical and administrative approaches, respectively, in CPPI 2021. The Container Port Performance Index 2022 | 34
- 43. Port Name Overall Ranking Jeddah 29 Pipavav 30 Dammam 31 Coronel 32 Xiamen 33 Barcelona 34 Callao 35 Port Klang 36 Incheon 37 Jebel Ali 38 Fuzhou 39 Marsaxlokk 40 Yarimca 41 Dalian 42 Lazaro Cardenas 43 Wilmington (USA-N Carolina) 44 Kobe 45 Nagoya 46 Shimizu 47 Mundra 48 Sohar 49 Rio Grande (Brazil) 50 Piraeus 51 Port Of Virginia 52 Yantian 53 Tokyo 54 Altamira 55 Haifa 56 Port Name Overall Ranking Yangshan 1 Salalah 2 Khalifa Port 3 Tanger-Mediterranean 4 Cartagena (Colombia) 5 Tanjung Pelepas 6 Ningbo 7 Hamad Port 8 Guangzhou 9 Port Said 10 Hong Kong 11 Cai Mep 12 Shekou 13 Mawan 14 Yokohama 15 Algeciras 16 King Abdullah Port 17 Singapore 18 Posorja 19 Tianjin 20 Buenaventura 21 Busan 22 Yeosu 23 Chiwan 24 Kaohsiung 25 Djibouti 26 Laem Chabang 27 Colombo 28 Table 3.1 • The CPPI 2022 35 | The Container Port Performance Index 2022 Three ports in the Middle East have secured positions among the top 10 spots. Three of the large Chinese gateways–Shanghai (Yangshan), Ningbo, and the southern port of Guangzhou–maintained places in the top 10. Of the top 10 ranked ports, nine have either maintained or improved their position since CPPI 2021. The exception is Hamad Port, which moved down five and three places (provide the rankings, sincethey’re specified for Yokohama and Jeddah) in the administrative and statistical rankings, respectively. Yokohama fell from the 10th and 12th ranks in CPPI 2021 to the 15th in CPPI 2022, and Jeddah fell from the 8th (provide both administrative and statistical rankings) to 29th. There are 14 new entrants to the CPPI 2022, and several significant gainers in terms of ranking. Over 110 ports improved their rankings in CPPI 2022 over CPPI 2021, with some of the largest gainers moving up more than 200 positions. In contrast, 200 ports fell in the CPPI 2022 rankings, some falling nearly 260 positions, which is 40 positions fewer than the biggest fall in the previous CPPI edition.
- 44. Port Name Overall Ranking Ambarli 57 Jubail 58 Aqaba 59 Bremerhaven 60 Itapoa 61 Zeebrugge 62 Da Chan Bay Terminal One 63 Krishnapatnam 64 Zhoushan 65 Antwerp 66 Rio De Janeiro 67 Savona-Vado 68 Boston (USA) 69 Keelung 70 Santa Cruz De Tenerife 71 Paranagua 72 Khalifa Bin Salman 73 Siam Seaport 74 Diliskelesi 75 Balboa 76 Shantou 77 Kattupalli 78 Port Name Overall Ranking Kamarajar 79 Osaka 80 Colon 81 Jacksonville 82 Lianyungang 83 Karachi 84 Hazira 85 Jawaharlal Nehru Port 86 Puerto Limon 87 Cochin 88 Port Everglades 89 Muhammad Bin Qasim 90 Johor 91 Penang 92 Aarhus 93 Puerto Cortes 94 Fort-De-France 95 Pointe-A-Pitre 96 Tanjung Perak 97 Philadelphia 98 Veracruz 99 Nemrut Bay 100 Source: Original table produced for this publication, based on CPPI 2022 data The CPPI 2022 shows reduced discrepancies between the two approaches compared to its previous edition. In CPPI 2022, 40 percent of all ports (140 ports) are ranked within three places or less from themselves in the dual rankings (a 2 percent improvement). In CPPI 2021, 38 percent of all ports (139 ports) are ranked within three places or less from themselves in the dual rankings (a 20 percent improvement). In CPPI 2020, just under 18 percent of all ports (61 ports) were ranked within three places or less from themselves in the dual rankings. The reduction in discrepancies contributes significantly to having a well-balanced aggregated index. The Container Port Performance Index 2022 | 36
- 45. Ranking by Region This section presents an overview of the outcomes from the CPPI 2022 report. The first edition of CPPI was modified based on requests for the presentation of results and rankings by region and throughput for an improved comparison of ports within the same region and those with similar throughput. The subsequent sections include a concise tabulation of the results and ranking (from Table 3.2) for the designated regions. • North America (United States and Canada) • Central America, South America, and the Caribbean Region • West, Central, and South Asia (Saudi Arabia to Bangladesh) • East Asia (Myanmar to Japan) • Oceania (Australia, New Zealand, and the Pacific Islands) • Sub-Saharan Africa • Europe and North Africa Table 3.2 • The CPPI by Region: North America Port Name Region Overall Ranking Wilmington (USA-N Carolina) NAM 44 Port Of Virginia NAM 52 Boston (USA) NAM 69 Jacksonville NAM 82 Port Everglades NAM 89 Philadelphia NAM 98 New Orleans NAM 113 Port Tampa Bay NAM 145 Apra Harbor NAM 203 Miami NAM 217 Saint John NAM 233 Mobile NAM 238 Hueneme NAM 242 Halifax NAM 278 Seattle NAM 279 Montreal NAM 292 Baltimore (USA) NAM 300 New York New Jersey NAM 306 37 | The Container Port Performance Index 2022
- 46. Port Name Region Overall Ranking Tacoma NAM 314 Houston NAM 335 Los Angeles NAM 336 Charleston NAM 340 Prince Rupert NAM 342 Oakland NAM 343 Long Beach NAM 346 Vancouver (Canada) NAM 347 Savannah NAM 348 Source: Original table produced for this publication, based on CPPI 2022 data Table 3.3 • The CPPI by Region: Central America, South America, and the Caribbean Region Port Name Region Overall Ranking Cartagena (Colombia) Lac 5 Posorja Lac 19 Buenaventura Lac 21 Coronel Lac 32 Callao Lac 35 Lazaro Cardenas Lac 43 Rio Grande (Brazil) Lac 50 Altamira Lac 55 Itapoa Lac 61 Rio De Janeiro Lac 67 Paranagua Lac 72 Balboa Lac 76 Colon Lac 81 Puerto Limon Lac 87 Puerto Cortes Lac 94 Fort-De-France Lac 95 Pointe-A-Pitre Lac 96 Veracruz Lac 99 Paita Lac 101 Ensenada Lac 105 Imbituba Lac 108 Santos Lac 114 Pecem Lac 116 Puerto Barrios Lac 119 Port Name Region Overall Ranking Salvador Lac 120 Puerto Quetzal Lac 129 San Juan Lac 130 Santa Marta Lac 131 Lirquen Lac 141 Puerto Bolivar (Ecuador) Lac 147 Caucedo Lac 148 Rio Haina Lac 158 Puerto Progreso Lac 162 Barranquilla Lac 164 Gustavia Lac 167 Philipsburg Lac 169 Vitoria Lac 170 Buenos Aires Lac 174 Suape Lac 178 Sepetiba Lac 182 Valparaiso Lac 188 Vila Do Conde Lac 190 Mariel Lac 209 Caldera (Costa Rica) Lac 211 La Guaira Lac 212 Nassau Lac 229 Point Lisas Ports Lac 232 Manaus Lac 236 The Container Port Performance Index 2022 | 38
- 47. Port Name Region Overall Ranking Arica Lac 237 Port Of Spain Lac 239 Itajai Lac 240 San Antonio Lac 253 Puerto Cabello Lac 255 San Vicente Lac 257 Corinto Lac 259 Santo Tomas De Castilla Lac 263 Kingston (Jamaica) Lac 266 Port Name Region Overall Ranking Mejillones Lac 272 Manzanillo (Mexico) Lac 282 Guayaquil Lac 283 Iquique Lac 284 Antofagasta Lac 286 Acajutla Lac 288 Montevideo Lac 304 Cristobal Lac 305 Freeport (Bahamas) Lac 317 Source: Original table produced for this publication, based on CPPI 2022 data Table 3.4 • The CPPI by Region: West, Central, and South Asia (Saudi Arabia to Bangladesh) Port Name Region Overall Ranking Salalah WCSA 2 Khalifa Port WCSA 3 Hamad Port WCSA 8 King Abdullah Port WCSA 17 Colombo WCSA 28 Jeddah WCSA 29 Pipavav WCSA 30 Dammam WCSA 31 Jebel Ali WCSA 38 Mundra WCSA 48 Sohar WCSA 49 Jubail WCSA 58 Aqaba WCSA 59 Krishnapatnam WCSA 64 Khalifa Bin Salman WCSA 73 Kattupalli WCSA 78 Kamarajar WCSA 79 Karachi WCSA 84 Hazira WCSA 85 Jawaharlal Nehru Port WCSA 86 Cochin WCSA 88 Muhammad Bin Qasim WCSA 90 Chennai WCSA 110 39 | The Container Port Performance Index 2022
- 48. Port Name Region Overall Ranking Visakhapatnam WCSA 115 Shuaiba WCSA 121 Sharjah WCSA 127 Shuwaikh WCSA 142 Umm Qasr WCSA 165 Aden WCSA 262 Chattogram WCSA 307 Source: Original table produced for this publication, based on CPPI 2022 data Port Name Region Overall Ranking Yangshan EAS 1 Tanjung Pelepas EAS 6 Ningbo EAS 7 Guangzhou EAS 9 Hong Kong EAS 11 Cai Mep EAS 12 Shekou EAS 13 Mawan EAS 14 Yokohama EAS 15 Singapore EAS 18 Tianjin EAS 20 Busan EAS 22 Yeosu EAS 23 Chiwan EAS 24 Kaohsiung EAS 25 Laem Chabang EAS 27 Xiamen EAS 33 Port Klang EAS 36 Incheon EAS 37 Fuzhou EAS 39 Dalian EAS 42 Kobe EAS 45 Nagoya EAS 46 Shimizu EAS 47 Yantian EAS 53 Tokyo EAS 54 Da Chan Bay Terminal One EAS 63 Table 3.5 • The CPPI by Region: East Asia (Myanmar to Japan) Port Name Region Overall Ranking Zhoushan EAS 65 Keelung EAS 70 Siam Seaport EAS 74 Shantou EAS 77 Osaka EAS 80 Lianyungang EAS 83 Johor EAS 91 Penang EAS 92 Tanjung Perak EAS 97 Yokkaichi EAS 102 Naha EAS 104 Cat Lai EAS 107 Hakata EAS 109 Danang EAS 117 Saigon EAS 124 Taichung EAS 125 Tanjung Emas EAS 132 Omaezaki EAS 133 Batangas EAS 135 Moji EAS 136 Haiphong EAS 140 Cebu EAS 143 Quy Nhon EAS 146 Chu Lai EAS 155 Cagayan De Oro EAS 156 Qingdao EAS 171 Subic Bay EAS 193 The Container Port Performance Index 2022 | 40
- 49. Port Name Region Overall Ranking Tomakomai EAS 208 Belawan EAS 214 Shanghai EAS 215 Panjang EAS 228 Source: Original table produced for this publication, based on CPPI 2022 data Table 3.6 • The CPPI by Region: Oceania (Australia, New Zealand, and the Pacific Islands) Port Name Region Overall Ranking Noumea OCE 128 Papeete OCE 139 Wellington OCE 153 Bluff OCE 191 Bell Bay OCE 192 Nelson OCE 204 Timaru OCE 250 Melbourne OCE 273 Lae OCE 274 Otago Harbour OCE 276 Adelaide OCE 277 Brisbane OCE 287 Port Botany OCE 299 Fremantle OCE 310 Lyttelton OCE 313 Napier OCE 322 Auckland OCE 323 Tauranga OCE 325 Source: Original table produced for this publication, based on CPPI 2022 data Port Name Region Overall Ranking Bangkok EAS 243 Davao EAS 251 Tanjung Priok EAS 281 Manila EAS 329 41 | The Container Port Performance Index 2022
- 50. Table 3.7 • The CPPI by Region: Sub-Saharan Africa Port Name Region Overall Ranking Djibouti SSA 26 Berbera SSA 144 Conakry SSA 189 Dakar SSA 196 Matadi SSA 197 Tema SSA 205 Mogadiscio SSA 221 Beira SSA 223 Freetown SSA 226 Toamasina SSA 227 Takoradi SSA 245 Maputo SSA 248 Port Victoria SSA 249 Lagos (Nigeria) SSA 260 Mayotte SSA 267 Monrovia SSA 271 Owendo SSA 275 Port Elizabeth SSA 291 Walvis Bay SSA 293 Douala SSA 295 San Pedro (Cote D'ivoire) SSA 296 Port Reunion SSA 298 Onne SSA 302 Tin Can Island SSA 308 Dar Es Salaam SSA 312 Pointe-Noire SSA 315 Lome SSA 318 Kribi Deep Sea Port SSA 324 Mombasa SSA 326 Port Louis SSA 327 Cotonou SSA 330 Nouakchott SSA 331 Abidjan SSA 333 Luanda SSA 337 Ngqura SSA 338 Durban SSA 341 Cape Town SSA 344 Source: Original table produced for this publication, based on CPPI 2022 data The Container Port Performance Index 2022 | 42
- 51. Port Name Region Overall Ranking Tanger-Mediterranean ENA 4 Port Said ENA 10 Algeciras ENA 16 Barcelona ENA 34 Marsaxlokk ENA 40 Yarimca ENA 41 Piraeus ENA 51 Haifa ENA 56 Ambarli ENA 57 Bremerhaven ENA 60 Zeebrugge ENA 62 Antwerp ENA 66 Savona-Vado ENA 68 Santa Cruz De Tenerife ENA 71 Diliskelesi ENA 75 Aarhus ENA 93 Nemrut Bay ENA 100 Limassol ENA 103 Malaga ENA 106 Gemlik ENA 111 Mersin ENA 112 Wilhelmshaven ENA 118 Gothenburg ENA 122 Gioia Tauro ENA 123 Port Akdeniz ENA 126 Gijon ENA 134 Izmir ENA 137 Vigo ENA 138 Fredericia ENA 149 Odessa ENA 150 Helsingborg ENA 151 Cadiz ENA 152 Nantes-St Nazaire ENA 154 Ancona ENA 157 Casablanca ENA 159 Bar ENA 160 Ravenna ENA 161 Salerno ENA 163 Oslo ENA 166 Table 3.8 • The CPPI by Region: Europe and North Africa Port Name Region Overall Ranking Borusan ENA 168 El Dekheila ENA 172 Damietta ENA 173 Leixoes ENA 175 Brest ENA 176 Latakia ENA 177 Larvik ENA 179 Burgas ENA 180 Norrkoping ENA 181 Muuga-Port Of Tallinn ENA 183 Bari ENA 184 Civitavecchia ENA 185 Sines ENA 186 Copenhagen ENA 187 Novorossiysk ENA 194 Klaipeda ENA 195 Catania ENA 198 Palermo ENA 199 Rauma ENA 200 Heraklion ENA 201 Kristiansand ENA 202 Bilbao ENA 206 Trapani ENA 207 Rades ENA 210 Bordeaux ENA 213 Lisbon ENA 216 Marseille ENA 218 Tripoli (Lebanon) ENA 219 Helsinki ENA 220 Kotka ENA 222 Alicante ENA 224 Gdynia ENA 225 Batumi ENA 230 Riga ENA 231 Teesport ENA 234 Southampton ENA 235 Varna ENA 241 St Petersburg ENA 244 Venice ENA 246 43 | The Container Port Performance Index 2022
- 52. Port Name Region Overall Ranking Gavle ENA 247 Agadir ENA 252 Durres ENA 254 Bejaia ENA 256 Dublin ENA 258 London ENA 261 Felixstowe ENA 264 Rotterdam ENA 265 Alexandria (Egypt) ENA 268 Sokhna ENA 269 Naples ENA 270 Iskenderun ENA 280 Tarragona ENA 285 Gdansk ENA 289 Poti ENA 290 Port Name Region Overall Ranking Constantza ENA 294 Ashdod ENA 297 Valencia ENA 301 Qasr Ahmed ENA 303 Livorno ENA 309 Dunkirk ENA 311 Genoa ENA 316 Le Havre ENA 319 Beirut ENA 320 Thessaloniki ENA 321 Hamburg ENA 328 La Spezia ENA 332 Rijeka ENA 334 Trieste ENA 339 Koper ENA 345 Source: Original table produced for this publication, based on CPPI 2022 data Ranking by Throughput This section presents the CPPI 2022 by throughput. It offers a summary tabulation (from Table 3.9) by throughput using the following defined ranges: • Large: more than 4 million TEUs per year • Medium: between 0.5 million and 4 million TEUs per year • Small: less than 0.5 million TEUs per year Table 3.9 • The CPPI by Throughput: Large Ports (More than 4 million TEUs per Year) Port Name Region Overall Ranking Yangshan Large 1 Salalah Large 2 Khalifa Port Large 3 Tanger-Mediterranean Large 4 Tanjung Pelepas Large 6 Ningbo Large 7 Guangzhou Large 9 Hong Kong Large 11 Port Name Region Overall Ranking Cai Mep Large 12 Shekou Large 13 Algeciras Large 16 Singapore Large 18 Tianjin Large 20 Busan Large 22 Chiwan Large 24 Kaohsiung Large 25 The Container Port Performance Index 2022 | 44
- 53. Port Name Region Overall Ranking Laem Chabang Large 27 Colombo Large 28 Jeddah Large 29 Xiamen Large 33 Port Klang Large 36 Jebel Ali Large 38 Dalian Large 42 Mundra Large 48 Piraeus Large 51 Yantian Large 53 Tokyo Large 54 Bremerhaven Large 60 Zhoushan Large 65 Antwerp Large 66 Colon Large 81 Lianyungang Large 83 Jawaharlal Nehru Port Large 86 Port Name Region Overall Ranking Tanjung Perak Large 97 Cat Lai Large 107 Santos Large 114 Saigon Large 124 Qingdao Large 171 Shanghai Large 215 Rotterdam Large 265 Kingston (Jamaica) Large 266 Tanjung Priok Large 281 Valencia Large 301 New York New Jersey Large 306 Hamburg Large 328 Manila Large 329 Los Angeles Large 336 Long Beach Large 346 Savannah Large 348 Source: Original table produced for this publication, based on CPPI 2022 data Table 3.10 • The CPPI by Throughput: Medium Ports (between 0.5 million and 4 million TEUs per Year) Port Name Region Overall Ranking Cartagena (Colombia) Medium 5 Hamad Port Medium 8 Port Said Medium 10 Mawan Medium 14 Yokohama Medium 15 King Abdullah Port Medium 17 Posorja Medium 19 Buenaventura Medium 21 Yeosu Medium 23 Djibouti Medium 26 Pipavav Medium 30 Dammam Medium 31 Barcelona Medium 34 Callao Medium 35 Incheon Medium 37 Fuzhou Medium 39 Port Name Region Overall Ranking Marsaxlokk Medium 40 Lazaro Cardenas Medium 43 Wilmington (USA-N Carolina) Medium 44 Kobe Medium 45 Nagoya Medium 46 Shimizu Medium 47 Sohar Medium 49 Rio Grande (Brazil) Medium 50 Port Of Virginia Medium 52 Altamira Medium 55 Haifa Medium 56 Ambarli Medium 57 Jubail Medium 58 Aqaba Medium 59 Zeebrugge Medium 62 Da Chan Bay Terminal One Medium 63 45 | The Container Port Performance Index 2022
- 54. Port Name Region Overall Ranking Krishnapatnam Medium 64 Rio De Janeiro Medium 67 Savona-Vado Medium 68 Boston (USA) Medium 69 Keelung Medium 70 Paranagua Medium 72 Siam Seaport Medium 74 Diliskelesi Medium 75 Balboa Medium 76 Shantou Medium 77 Kattupalli Medium 78 Osaka Medium 80 Jacksonville Medium 82 Karachi Medium 84 Hazira Medium 85 Cochin Medium 88 Port Everglades Medium 89 Muhammad Bin Qasim Medium 90 Johor Medium 91 Penang Medium 92 Aarhus Medium 93 Veracruz Medium 99 Limassol Medium 103 Naha Medium 104 Hakata Medium 109 Chennai Medium 110 Gemlik Medium 111 Mersin Medium 112 New Orleans Medium 113 Danang Medium 117 Wilhelmshaven Medium 118 Gothenburg Medium 122 Gioia Tauro Medium 123 Taichung Medium 125 Sharjah Medium 127 Santa Marta Medium 131 Tanjung Emas Medium 132 Izmir Medium 137 Vigo Medium 138 Port Name Region Overall Ranking Papeete Medium 139 Haiphong Medium 140 Shuwaikh Medium 142 Cebu Medium 143 Berbera Medium 144 Puerto Bolivar (Ecuador) Medium 147 Caucedo Medium 148 Odessa Medium 150 Wellington Medium 153 Ancona Medium 157 Casablanca Medium 159 Umm Qasr Medium 165 Oslo Medium 166 El Dekheila Medium 172 Damietta Medium 173 Buenos Aires Medium 174 Leixoes Medium 175 Latakia Medium 177 Civitavecchia Medium 185 Sines Medium 186 Valparaiso Medium 188 Conakry Medium 189 Subic Bay Medium 193 Novorossiysk Medium 194 Klaipeda Medium 195 Dakar Medium 196 Catania Medium 198 Palermo Medium 199 Apra Harbor Medium 203 Tema Medium 205 Bilbao Medium 206 Rades Medium 210 La Guaira Medium 212 Belawan Medium 214 Miami Medium 217 Marseille Medium 218 Helsinki Medium 220 Mogadiscio Medium 221 Kotka Medium 222 The Container Port Performance Index 2022 | 46
- 55. Port Name Region Overall Ranking Gdynia Medium 225 Freetown Medium 226 Toamasina Medium 227 Panjang Medium 228 Batumi Medium 230 Teesport Medium 234 Southampton Medium 235 Manaus Medium 236 Mobile Medium 238 Port Of Spain Medium 239 Itajai Medium 240 Varna Medium 241 Bangkok Medium 243 St Petersburg Medium 244 Takoradi Medium 245 Venice Medium 246 Gavle Medium 247 Timaru Medium 250 Davao Medium 251 Agadir Medium 252 San Antonio Medium 253 Durres Medium 254 Puerto Cabello Medium 255 Bejaia Medium 256 Dublin Medium 258 Lagos (Nigeria) Medium 260 London Medium 261 Aden Medium 262 Santo Tomas De Castilla Medium 263 Felixstowe Medium 264 Alexandria (Egypt) Medium 268 Sokhna Medium 269 Naples Medium 270 Monrovia Medium 271 Melbourne Medium 273 Owendo Medium 275 Otago Harbour Medium 276 Adelaide Medium 277 Halifax Medium 278 Port Name Region Overall Ranking Seattle Medium 279 Iskenderun Medium 280 Manzanillo (Mexico) Medium 282 Guayaquil Medium 283 Iquique Medium 284 Brisbane Medium 287 Acajutla Medium 288 Gdansk Medium 289 Poti Medium 290 Port Elizabeth Medium 291 Montreal Medium 292 Constantza Medium 294 Douala Medium 295 San Pedro (Cote D'ivoire) Medium 296 Ashdod Medium 297 Port Reunion Medium 298 Port Botany Medium 299 Baltimore (USA) Medium 300 Onne Medium 302 Qasr Ahmed Medium 303 Montevideo Medium 304 Cristobal Medium 305 Chattogram Medium 307 Tin Can Island Medium 308 Livorno Medium 309 Fremantle Medium 310 Dar Es Salaam Medium 312 Lyttelton Medium 313 Tacoma Medium 314 Pointe-Noire Medium 315 Genoa Medium 316 Freeport (Bahamas) Medium 317 Lome Medium 318 Le Havre Medium 319 Beirut Medium 320 Napier Medium 322 Auckland Medium 323 Tauranga Medium 325 Mombasa Medium 326 47 | The Container Port Performance Index 2022
- 56. Port Name Region Overall Ranking Port Louis Medium 327 Cotonou Medium 330 La Spezia Medium 332 Abidjan Medium 333 Houston Medium 335 Luanda Medium 337 Ngqura Medium 338 Trieste Medium 339 Source: Original table produced for this publication, based on CPPI 2022 data Table 3.11 • The CPPI by Throughput: Small Ports (Less than 0.5 million TEUs per Year) Port Name Region Overall Ranking Coronel Small 32 Yarimca Small 41 Itapoa Small 61 Santa Cruz De Tenerife Small 71 Khalifa Bin Salman Small 73 Kamarajar Small 79 Puerto Limon Small 87 Puerto Cortes Small 94 Fort-De-France Small 95 Pointe-A-Pitre Small 96 Philadelphia Small 98 Nemrut Bay Small 100 Paita Small 101 Yokkaichi Small 102 Ensenada Small 105 Malaga Small 106 Imbituba Small 108 Visakhapatnam Small 115 Pecem Small 116 Puerto Barrios Small 119 Salvador Small 120 Shuaiba Small 121 Port Akdeniz Small 126 Noumea Small 128 Puerto Quetzal Small 129 San Juan Small 130 Port Name Region Overall Ranking Omaezaki Small 133 Gijon Small 134 Batangas Small 135 Moji Small 136 Lirquen Small 141 Port Tampa Bay Small 145 Quy Nhon Small 146 Fredericia Small 149 Helsingborg Small 151 Cadiz Small 152 Nantes-St Nazaire Small 154 Chu Lai Small 155 Cagayan De Oro Small 156 Rio Haina Small 158 Bar Small 160 Ravenna Small 161 Puerto Progreso Small 162 Salerno Small 163 Barranquilla Small 164 Gustavia Small 167 Borusan Small 168 Philipsburg Small 169 Vitoria Small 170 Brest Small 176 Suape Small 178 Larvik Small 179 Port Name Region Overall Ranking Charleston Medium 340 Durban Medium 341 Prince Rupert Medium 342 Oakland Medium 343 Cape Town Medium 344 Koper Medium 345 Vancouver (Canada) Medium 347 The Container Port Performance Index 2022 | 48
- 57. Port Name Region Overall Ranking Burgas Small 180 Norrkoping Small 181 Sepetiba Small 182 Muuga-Port Of Tallinn Small 183 Bari Small 184 Copenhagen Small 187 Vila Do Conde Small 190 Bluff Small 191 Bell Bay Small 192 Matadi Small 197 Rauma Small 200 Heraklion Small 201 Kristiansand Small 202 Nelson Small 204 Trapani Small 207 Tomakomai Small 208 Mariel Small 209 Caldera (Costa Rica) Small 211 Bordeaux Small 213 Lisbon Small 216 Tripoli (Lebanon) Small 219 Beira Small 223 Port Name Region Overall Ranking Alicante Small 224 Nassau Small 229 Riga Small 231 Point Lisas Ports Small 232 Saint John Small 233 Arica Small 237 Hueneme Small 242 Maputo Small 248 Port Victoria Small 249 San Vicente Small 257 Corinto Small 259 Mayotte Small 267 Mejillones Small 272 Lae Small 274 Tarragona Small 285 Antofagasta Small 286 Walvis Bay Small 293 Dunkirk Small 311 Thessaloniki Small 321 Kribi Deep Sea Port Small 324 Nouakchott Small 331 Rijeka Small 334 Source: Original table produced for this publication, based on CPPI 2022 data. 49 | The Container Port Performance Index 2022
- 58. 4 4. Conclusions and Next Steps The primary objective of developing the CPPI by utilizing existing empirical data was to create an impartial benchmark to assess and compare container port performance across different ports, over time. This was done to facilitate the identification of gaps and opportunities for improvement in a standardized manner, which could ultimately benefit all stakeholders, including shipping lines, national governments, and consumers. The CPPI was intended to serve as a crucial point of reference for various stakeholders in the global economy, such as port authorities and operators, national governments, development agencies, supranational organizations, and other public and private entities involved in trade, logistics, and supply chain services. In the future, the CPPI is expected to undergo further refinement in subsequent editions, incorporating stakeholder feedback, advancements in data scope and quality, and additional trend analysis. The World Bank-SP Global Market Intelligence team will continue to improve the methodologies, expand the scope by potentially including more ports, and enhance the data. The next version, CPPI 2023, will be comparable to the current edition, facilitating trend analysis of container port performance across the aggregate index. Specifically, subsequent releases will also contain indices aggregated from the statistical and administrative approaches. CPPI 2022 considers the dissimilarities between the two approaches while simultaneously gaining a deeper understanding of the vital factors that affect container port performance. The goal remains to identify opportunities for improvement to benefit all stakeholders, including ports, shipping lines, governments, line agencies, businesses, and consumers. Conclusions and Next Steps | 50
- 59. Appendix A: The CPPI 2022 Table A.1. • Aggregated Rankings Using Borda-type Approach Port Name Overall Ranking Yangshan 1 Salalah 2 Khalifa Port 3 Tanger-Mediterranean 4 Cartagena (Colombia) 5 Tanjung Pelepas 6 Ningbo 7 Hamad Port 8 Guangzhou 9 Port Said 10 Hong Kong 11 Cai Mep 12 Shekou 13 Mawan 14 Yokohama 15 Algeciras 16 Port Name Overall Ranking King Abdullah Port 17 Singapore 18 Posorja 19 Tianjin 20 Buenaventura 21 Busan 22 Yeosu 23 Chiwan 24 Kaohsiung 25 Djibouti 26 Laem Chabang 27 Colombo 28 Jeddah 29 Pipavav 30 Dammam 31 Coronel 32 51 | Conclusions and Next Steps
- 60. Port Name Overall Ranking Xiamen 33 Barcelona 34 Callao 35 Port Klang 36 Incheon 37 Jebel Ali 38 Fuzhou 39 Marsaxlokk 40 Yarimca 41 Dalian 42 Lazaro Cardenas 43 Wilmington (USA-N Carolina) 44 Kobe 45 Nagoya 46 Shimizu 47 Mundra 48 Sohar 49 Rio Grande (Brazil) 50 Piraeus 51 Port Of Virginia 52 Yantian 53 Tokyo 54 Altamira 55 Haifa 56 Ambarli 57 Jubail 58 Aqaba 59 Bremerhaven 60 Itapoa 61 Zeebrugge 62 Da Chan Bay Terminal One 63 Krishnapatnam 64 Zhoushan 65 Antwerp 66 Rio De Janeiro 67 Savona-Vado 68 Boston (USA) 69 Keelung 70 Santa Cruz De Tenerife 71 Paranagua 72 Port Name Overall Ranking Khalifa Bin Salman 73 Siam Seaport 74 Diliskelesi 75 Balboa 76 Shantou 77 Kattupalli 78 Kamarajar 79 Osaka 80 Colon 81 Jacksonville 82 Lianyungang 83 Karachi 84 Hazira 85 Jawaharlal Nehru Port 86 Puerto Limon 87 Cochin 88 Port Everglades 89 Muhammad Bin Qasim 90 Johor 91 Penang 92 Aarhus 93 Puerto Cortes 94 Fort-De-France 95 Pointe-A-Pitre 96 Tanjung Perak 97 Philadelphia 98 Veracruz 99 Nemrut Bay 100 Paita 101 Yokkaichi 102 Limassol 103 Naha 104 Ensenada 105 Malaga 106 Cat Lai 107 Imbituba 108 Hakata 109 Chennai 110 Gemlik 111 Mersin 112 Conclusions and Next Steps | 52
- 61. Port Name Overall Ranking New Orleans 113 Santos 114 Visakhapatnam 115 Pecem 116 Danang 117 Wilhelmshaven 118 Puerto Barrios 119 Salvador 120 Shuaiba 121 Gothenburg 122 Gioia Tauro 123 Saigon 124 Taichung 125 Port Akdeniz 126 Sharjah 127 Noumea 128 Puerto Quetzal 129 San Juan 130 Santa Marta 131 Tanjung Emas 132 Omaezaki 133 Gijon 134 Batangas 135 Moji 136 Izmir 137 Vigo 138 Papeete 139 Haiphong 140 Lirquen 141 Shuwaikh 142 Cebu 143 Berbera 144 Port Tampa Bay 145 Quy Nhon 146 Puerto Bolivar (Ecuador) 147 Caucedo 148 Fredericia 149 Odessa 150 Helsingborg 151 Cadiz 152 Port Name Overall Ranking Wellington 153 Nantes-St Nazaire 154 Chu Lai 155 Cagayan De Oro 156 Ancona 157 Rio Haina 158 Casablanca 159 Bar 160 Ravenna 161 Puerto Progreso 162 Salerno 163 Barranquilla 164 Umm Qasr 165 Oslo 166 Gustavia 167 Borusan 168 Philipsburg 169 Vitoria 170 Qingdao 171 El Dekheila 172 Damietta 173 Buenos Aires 174 Leixoes 175 Brest 176 Latakia 177 Suape 178 Larvik 179 Burgas 180 Norrkoping 181 Sepetiba 182 Muuga-Port Of Tallinn 183 Bari 184 Civitavecchia 185 Sines 186 Copenhagen 187 Valparaiso 188 Conakry 189 Vila Do Conde 190 Bluff 191 Bell Bay 192 53 | Conclusions and Next Steps
- 62. Port Name Overall Ranking Subic Bay 193 Novorossiysk 194 Klaipeda 195 Dakar 196 Matadi 197 Catania 198 Palermo 199 Rauma 200 Heraklion 201 Kristiansand 202 Apra Harbor 203 Nelson 204 Tema 205 Bilbao 206 Trapani 207 Tomakomai 208 Mariel 209 Rades 210 Caldera (Costa Rica) 211 La Guaira 212 Bordeaux 213 Belawan 214 Shanghai 215 Lisbon 216 Miami 217 Marseille 218 Tripoli (Lebanon) 219 Helsinki 220 Mogadiscio 221 Kotka 222 Beira 223 Alicante 224 Gdynia 225 Freetown 226 Toamasina 227 Panjang 228 Nassau 229 Batumi 230 Riga 231 Point Lisas Ports 232 Port Name Overall Ranking Saint John 233 Teesport 234 Southampton 235 Manaus 236 Arica 237 Mobile 238 Port Of Spain 239 Itajai 240 Varna 241 Hueneme 242 Bangkok 243 St Petersburg 244 Takoradi 245 Venice 246 Gavle 247 Maputo 248 Port Victoria 249 Timaru 250 Davao 251 Agadir 252 San Antonio 253 Durres 254 Puerto Cabello 255 Bejaia 256 San Vicente 257 Dublin 258 Corinto 259 Lagos (Nigeria) 260 London 261 Aden 262 Santo Tomas De Castilla 263 Felixstowe 264 Rotterdam 265 Kingston (Jamaica) 266 Mayotte 267 Alexandria (Egypt) 268 Sokhna 269 Naples 270 Monrovia 271 Mejillones 272 Conclusions and Next Steps | 54
- 63. Port Name Overall Ranking Melbourne 273 Lae 274 Owendo 275 Otago Harbour 276 Adelaide 277 Halifax 278 Seattle 279 Iskenderun 280 Tanjung Priok 281 Manzanillo (Mexico) 282 Guayaquil 283 Iquique 284 Tarragona 285 Antofagasta 286 Brisbane 287 Acajutla 288 Gdansk 289 Poti 290 Port Elizabeth 291 Montreal 292 Walvis Bay 293 Constantza 294 Douala 295 San Pedro (Cote D'ivoire) 296 Ashdod 297 Port Reunion 298 Port Botany 299 Baltimore (USA) 300 Valencia 301 Onne 302 Qasr Ahmed 303 Montevideo 304 Cristobal 305 New York New Jersey 306 Chattogram 307 Tin Can Island 308 Livorno 309 Fremantle 310 Port Name Overall Ranking Dunkirk 311 Dar Es Salaam 312 Lyttelton 313 Tacoma 314 Pointe-Noire 315 Genoa 316 Freeport (Bahamas) 317 Lome 318 Le Havre 319 Beirut 320 Thessaloniki 321 Napier 322 Auckland 323 Kribi Deep Sea Port 324 Tauranga 325 Mombasa 326 Port Louis 327 Hamburg 328 Manila 329 Cotonou 330 Nouakchott 331 La Spezia 332 Abidjan 333 Rijeka 334 Houston 335 Los Angeles 336 Luanda 337 Ngqura 338 Trieste 339 Charleston 340 Durban 341 Prince Rupert 342 Oakland 343 Cape Town 344 Koper 345 Long Beach 346 Vancouver (Canada) 347 Savannah 348 Source: Original table produced for this publication, based on CPPI 2022 data. 55 | Conclusions and Next Steps
- 64. Table A.2. • The CPPI 2022 (the Administrative Approach) RANK PER SHIP SIZE RANGE Port Name Rank Index Points Total Calls 1,500 1,501- 5,000 5,001- 8,500 8,501- 13,500 13,500 2021 Change Yangshan 1 215.01 3,664 11 5 3 4 4 4 3 Salalah 2 212.30 1,397 12 4 1 1 2 0 Khalifa Port 3 199.54 896 86 47 10 7 5 5 2 Cartagena (Colombia) 4 197.50 1,274 23 16 18 5 8 12 8 Tanger-Mediterranean 5 193.48 3,097 163 50 11 12 2 6 1 Tanjung Pelepas 6 188.19 3,935 142 104 26 9 3 18 12 Ningbo 7 184.53 4,274 39 27 17 11 13 7 0 Hamad Port 8 182.55 257 1 14 16 11 3 -5 Guangzhou 9 181.18 1,577 89 20 15 14 15 9 0 Hong Kong 10 178.10 3,743 99 58 29 25 7 50 40 Port Said 11 177.29 1,106 52 48 23 15 14 15 4 Yokohama 12 171.48 1,217 33 2 44 8 24 10 -2 Cai Mep 13 170.77 939 19 51 5 53 10 13 0 Shekou 14 169.53 852 125 64 35 19 12 16 2 Mawan 15 166.32 295 62 23 31 18 18 44 29 King Abdullah Port 16 165.14 164 83 6 158 2 6 1 -15 Posorja 17 163.88 203 7 22 2 27 30 66 49 Algeciras 18 162.03 2,078 71 59 30 22 17 11 -7 Singapore 19 157.54 6,370 192 88 59 32 9 31 12 Buenaventura 20 149.84 430 13 43 23 25 20 0 Yeosu 21 149.64 576 43 37 33 30 26 33 12 Busan 22 148.62 4,783 72 65 32 44 19 25 3 Chiwan 23 147.58 879 79 76 42 31 22 17 -6 Djibouti 24 145.91 248 40 39 22 42 32 19 -5 Tianjin 25 145.84 1,035 143 80 57 13 31 27 2 Kaohsiung 26 142.03 2,426 85 103 40 28 29 21 -5 Laem Chabang 27 139.95 1,098 101 81 37 35 27 57 30 Jeddah 28 132.06 1,292 265 172 21 10 23 8 -20 Colombo 29 130.76 1,677 181 69 61 57 21 24 -5 Coronel 30 124.69 160 98 25 47 36 39 9 Pipavav 31 119.04 250 4 1 3 26 -5 Xiamen 32 118.65 2,201 205 179 96 34 20 45 13 Dammam 33 116.21 290 6 83 80 37 41 14 -19 Incheon 34 114.10 185 27 24 8 6 52 18 Barcelona 35 110.00 1,546 139 62 51 48 47 22 -13 Port Klang 36 107.29 2,536 172 116 81 52 38 69 33 Conclusions and Next Steps | 56
- 65. RANK PER SHIP SIZE RANGE Port Name Rank Index Points Total Calls 1,500 1,501- 5,000 5,001- 8,500 8,501- 13,500 13,500 2021 Change Lazaro Cardenas 37 107.00 725 165 87 63 58 40 92 55 Fuzhou 38 105.90 172 169 162 130 43 28 133 95 Yarimca 39 105.77 491 160 109 45 82 35 28 -11 Jebel Ali 40 102.66 1,931 201 129 67 39 43 38 -2 Wilmington (USA-N Carolina) 41 101.51 170 60 7 46 56 49 8 Marsaxlokk 42 99.25 1,322 212 146 84 50 39 74 32 Callao 43 98.02 833 255 158 99 38 34 258 215 Dalian 44 96.68 660 209 168 124 89 16 83 39 Sohar 45 94.66 148 28 70 54 54 54 47 2 Shimizu 46 94.31 340 15 11 69 17 41 -5 Kobe 47 91.38 1,058 42 15 24 41 40 -7 Nagoya 48 86.15 1,092 9 40 34 51 53 5 Port Of Virginia 49 83.17 1,313 64 63 73 64 55 23 -26 Mundra 50 82.64 690 233 36 48 21 48 -2 Yantian 51 81.91 2,954 259 149 103 73 33 266 215 Rio Grande (Brazil) 52 80.51 296 8 49 71 45 97 45 Piraeus 53 79.30 1,296 194 210 98 76 37 101 48 Tokyo 54 75.68 924 25 54 49 61 56 2 Altamira 55 74.93 576 153 110 82 20 85 30 Ambarli 56 73.76 800 69 135 115 66 51 43 -13 Aqaba 57 72.61 187 14 32 55 72 65 35 -22 Haifa 58 69.75 734 183 189 136 63 44 196 138 Savona-Vado 59 69.01 176 65 73 39 70 94 35 Bremerhaven 60 67.68 1,122 96 112 120 87 50 59 -1 Da Chan Bay Terminal One 61 67.65 227 97 56 78 59 142 81 Balboa 62 67.04 1,412 84 95 60 59 60 -2 Boston (USA) 63 66.36 86 86 56 55 117 54 Shantou 64 64.80 94 198 115 66 49 165 101 Jubail 65 64.54 173 66 60 80 60 249 184 Rio De Janeiro 66 64.12 533 67 85 64 69 93 27 Keelung 67 63.64 659 73 184 87 33 67 0 Zeebrugge 68 63.62 316 193 82 106 79 53 278 210 Itapoa 69 62.78 473 38 62 71 72 3 Paranagua 70 62.15 663 3 119 83 65 198 128 Krishnapatnam 71 61.72 60 2 28 13 95 24 Siam Seaport 72 61.42 346 4 26 36 103 31 Khalifa Bin Salman 73 60.52 120 12 21 40 62 -11 Diliskelesi 74 60.47 161 22 29 72 86 77 3 57 | Conclusions and Next Steps
- 66. RANK PER SHIP SIZE RANGE Port Name Rank Index Points Total Calls 1,500 1,501- 5,000 5,001- 8,500 8,501- 13,500 13,500 2021 Change Santa Cruz De Tenerife 75 60.32 168 18 44 6 71 -4 Antwerp 76 60.31 3,121 131 145 133 75 52 96 20 Lianyungang 77 59.47 118 178 101 24 78 1 Zhoushan 78 57.11 382 230 206 147 68 42 136 58 Osaka 79 55.31 462 10 14 41 36 -43 Kamarajar 80 54.59 102 8 16 84 4 Penang 81 54.22 135 209 105 26 111 30 Kattupalli 82 53.95 142 21 31 28 106 24 Jacksonville 83 53.54 133 41 86 78 100 17 Cochin 84 53.12 33 10 19 99 15 Karachi 85 52.69 286 148 92 56 90 5 Hazira 86 50.37 97 7 36 68 -18 Puerto Limon 87 48.38 380 46 20 86 -1 Muhammad Bin Qasim 88 45.12 548 129 118 89 81 81 -7 Port Everglades 89 44.97 400 61 78 94 90 116 27 Johor 90 44.53 137 56 25 76 80 -10 Jawaharlal Nehru Port 91 42.74 963 224 91 102 74 54 -37 Puerto Cortes 92 42.33 193 100 97 52 144 52 Philadelphia 93 41.34 466 268 68 77 62 55 -38 Fort-De-France 94 41.17 82 94 139 38 122 28 Colon 95 41.03 1,238 80 138 74 100 64 73 -22 Aarhus 96 39.61 189 48 105 88 62 82 -14 Pointe-A-Pitre 97 39.31 177 92 137 50 109 12 Yokkaichi 98 39.24 213 18 79 91 -7 Tanjung Perak 99 38.97 273 78 96 70 107 8 Limassol 100 36.89 105 70 198 27 147 47 Naha 101 36.33 33 9 120 19 Paita 102 36.19 231 107 58 75 -27 Nemrut Bay 103 35.50 840 128 127 119 101 58 224 121 Veracruz 104 35.40 444 161 102 68 104 0 Pecem 105 33.11 109 99 109 91 121 16 Imbituba 106 32.19 57 140 91 95 51 -55 Chennai 107 30.88 79 94 85 79 -28 Hakata 108 28.34 214 26 3 128 20 Ensenada 109 28.26 166 35 97 115 102 -7 Cat Lai 110 28.04 626 5 9 145 35 Malaga 111 26.48 177 90 95 134 93 68 137 26 Visakhapatnam 112 26.25 59 30 121 98 -14 Conclusions and Next Steps | 58
- 67. RANK PER SHIP SIZE RANGE Port Name Rank Index Points Total Calls 1,500 1,501- 5,000 5,001- 8,500 8,501- 13,500 13,500 2021 Change Gothenburg 113 25.96 235 202 187 188 29 57 118 5 Santos 114 24.91 1,193 93 202 132 85 66 188 74 Salvador 115 23.99 253 173 128 88 112 -3 Danang 116 23.31 127 16 43 161 45 Puerto Barrios 117 22.77 144 30 42 170 53 Puerto Quetzal 118 21.86 296 79 75 128 110 -8 Shuaiba 119 21.26 163 17 67 185 66 Sharjah 120 20.56 62 84 45 155 35 Saigon 121 19.94 270 24 74 140 19 Noumea 122 19.70 86 76 53 88 -34 Gijon 123 19.48 72 32 77 236 113 Lirquen 124 19.39 57 13 143 108 119 126 2 Taichung 125 19.35 372 46 72 125 0 Omaezaki 126 18.93 45 17 127 1 Santa Marta 127 18.75 231 19 143 16 Batangas 128 18.56 41 109 57 #N/A #N/A Port Tampa Bay 129 18.46 129 103 61 143 106 64 -65 Gemlik 130 18.27 709 51 52 53 144 113 -17 Port Akdeniz 131 18.04 95 20 101 152 21 Mersin 132 17.99 885 253 295 114 103 45 34 -98 Gioia Tauro 133 17.98 56 145 116 96 65 -68 San Juan 134 17.91 153 82 75 157 23 Moji 135 17.30 24 34 132 -3 Tanjung Emas 136 17.28 124 53 89 153 17 New Orleans 137 16.61 340 90 111 118 115 -22 Haiphong 138 15.79 557 141 123 93 126 63 -75 Quy Nhon 139 15.55 50 108 93 154 15 Vigo 140 15.51 284 37 114 149 9 Papeete 141 15.24 62 98 100 167 26 Puerto Bolivar (Ecuador) 142 15.12 97 55 156 14 Cebu 143 14.86 61 50 117 164 21 El Dekheila 144 14.78 182 112 165 135 139 -5 Wilhelmshaven 145 14.63 315 88 163 125 67 80 233 88 Berbera 146 14.62 47 44 124 184 38 Nantes-St Nazaire 147 14.36 154 114 220 112 105 -42 Wellington 148 14.27 82 180 118 151 3 Izmir 149 14.22 224 107 166 137 253 104 Helsingborg 150 13.89 72 81 120 168 18 59 | Conclusions and Next Steps
- 68. RANK PER SHIP SIZE RANGE Port Name Rank Index Points Total Calls 1,500 1,501- 5,000 5,001- 8,500 8,501- 13,500 13,500 2021 Change Bar 151 13.52 101 59 130 183 32 Shuwaikh 152 13.33 185 68 132 189 37 Fredericia 153 13.31 57 63 134 176 23 Damietta 154 13.27 550 152 248 129 97 61 58 -96 Casablanca 155 12.98 262 226 270 47 262 107 Salerno 156 12.94 156 110 122 192 36 Puerto Progreso 157 12.91 34 35 152 200 43 Caucedo 158 12.77 559 171 199 140 92 114 -44 Rio Haina 159 12.70 76 134 111 158 -1 Oslo 160 12.61 53 38 153 146 -14 Cadiz 161 12.20 24 120 126 221 60 Philipsburg 162 12.02 51 157 108 177 15 Chu Lai 163 11.95 76 55 151 220 57 Odessa 164 11.67 35 29 71 121 209 45 Cagayan De Oro 165 11.52 42 66 155 208 43 Ancona 166 11.33 130 104 144 179 13 Ravenna 167 11.09 228 105 147 187 20 Buenos Aires 168 10.92 269 127 113 126 84 76 141 -27 Barranquilla 169 10.75 37 77 160 159 -10 Umm Qasr 170 9.65 141 224 113 150 -20 Gustavia 171 9.62 64 1 197 26 Leixoes 172 9.52 143 133 150 205 33 Borusan 173 9.42 88 121 148 -25 Burgas 174 9.41 92 54 175 195 21 Vitoria 175 8.64 62 45 185 217 42 Suape 176 8.50 189 201 122 109 280 104 Brest 177 8.28 24 147 159 #N/A #N/A Matadi 178 6.68 88 213 125 171 -7 Bari 179 6.61 51 121 183 193 14 Latakia 180 6.60 75 123 182 174 -6 Novorossiysk 181 6.49 140 136 186 102 172 -9 Norrkoping 182 6.48 42 157 182 0 Larvik 183 6.14 34 31 210 27 Dakar 184 5.23 398 238 222 107 303 119 Muuga-Port Of Tallinn 185 4.93 51 132 192 175 -10 Copenhagen 186 4.57 39 74 206 20 Civitavecchia 187 4.57 25 75 162 -25 Apra Harbor 188 4.41 29 176 199 11 Conclusions and Next Steps | 60
- 69. RANK PER SHIP SIZE RANGE Port Name Rank Index Points Total Calls 1,500 1,501- 5,000 5,001- 8,500 8,501- 13,500 13,500 2021 Change Valparaiso 189 4.29 252 212 90 127 108 -81 Bluff 190 4.07 31 106 207 241 51 Klaipeda 191 3.51 82 111 186 -5 Bell Bay 192 3.45 28 113 218 26 Catania 193 3.23 58 116 191 -2 Palermo 194 3.21 24 117 204 10 Heraklion 195 3.14 34 119 216 21 Conakry 196 2.93 146 126 213 242 46 Sepetiba 197 2.93 59 154 46 147 123 -74 Subic Bay 198 2.92 71 214 170 181 -17 Vila Do Conde 199 2.86 90 34 228 244 45 Kristiansand 200 2.81 30 130 223 23 Rauma 201 2.60 73 138 208 201 0 Sines 202 2.50 28 150 142 46 30 -172 Trapani 203 2.21 29 140 213 10 Nelson 204 1.60 77 148 218 194 -10 Tripoli (Lebanon) 205 1.11 91 60 33 135 87 -118 Bilbao 206 1.02 108 87 229 202 -4 Miami 207 0.99 348 36 308 127 83 29 -178 Mariel 208 0.36 30 177 222 14 Rades 209 0.06 71 182 237 28 Bordeaux 212 (0.08) 28 187 228 16 Caldera (Costa Rica) 213 (0.44) 36 219 260 47 Qingdao 214 (0.45) 2,705 249 243 154 130 48 42 -172 La Guaira 215 (0.48) 86 173 221 265 50 Tomakomai 216 (1.08) 33 170 225 239 23 Belawan 217 (2.12) 87 219 204 250 33 Shanghai 218 (2.45) 2,371 215 217 139 112 316 98 Tema 219 (2.70) 587 240 174 131 99 70 354 135 Lisbon 220 (2.88) 39 155 232 215 -5 Freetown 221 (2.90) 123 122 246 268 47 Southampton 222 (3.51) 430 128 104 113 75 346 124 Helsinki 223 (3.62) 42 164 235 180 -43 Nassau 224 (3.63) 108 47 259 212 -12 Mogadiscio 225 (3.79) 74 230 259 34 Kotka 226 (4.34) 65 166 241 243 17 Alicante 227 (4.52) 66 146 247 229 2 Marseille 228 (4.77) 473 158 167 145 107 71 315 87 61 | Conclusions and Next Steps
- 70. RANK PER SHIP SIZE RANGE Port Name Rank Index Points Total Calls 1,500 1,501- 5,000 5,001- 8,500 8,501- 13,500 13,500 2021 Change Beira 229 (5.02) 93 184 239 270 41 Panjang 230 (5.44) 43 242 246 16 Toamasina 231 (5.93) 141 124 260 279 48 Arica 232 (6.58) 125 159 164 170 297 65 Saint John 233 (7.37) 81 220 236 240 7 Manaus 234 (7.82) 101 253 263 29 Gdynia 235 (8.03) 266 156 194 117 111 73 255 20 Batumi 236 (8.05) 68 186 254 245 9 Varna 237 (8.18) 47 180 257 225 -12 Itajai 238 (8.91) 462 191 211 142 122 207 -31 Takoradi 239 (9.07) 27 196 256 281 42 Teesport 240 (9.37) 34 206 252 257 17 St Petersburg 241 (9.62) 95 137 272 256 15 Port Of Spain 242 (10.01) 103 176 266 254 12 Hueneme 243 (10.08) 44 264 269 26 Point Lisas Ports 244 (10.56) 45 254 295 51 Mobile 245 (10.75) 339 57 169 149 133 163 -82 Bangkok 246 (11.11) 198 207 262 299 53 Timaru 247 (12.23) 47 273 310 63 Riga 248 (12.70) 56 248 233 214 -34 Gavle 249 (13.00) 52 229 263 252 3 Santo Tomas De Castilla 250 (14.25) 48 251 237 273 23 Port Victoria 251 (14.34) 45 282 289 38 Maputo 252 (14.77) 66 284 321 69 Davao 253 (15.09) 124 199 255 153 274 21 Venice 254 (15.37) 139 154 292 235 -19 Durres 255 (15.46) 72 151 293 309 54 Agadir 256 (15.69) 79 218 276 261 5 Corinto 257 (15.74) 25 286 286 29 Dublin 258 (17.01) 24 208 285 300 42 Bejaia 259 (17.33) 38 231 277 285 26 San Vicente 260 (18.03) 81 136 65 162 166 -94 Puerto Cabello 261 (18.24) 36 41 303 287 26 Felixstowe 262 (18.38) 540 245 200 165 105 67 334 72 Lagos (Nigeria) 263 (18.46) 192 135 250 169 358 95 Manzanillo (Mexico) 264 (19.80) 938 256 133 110 94 83 89 -175 San Antonio 265 (20.44) 319 115 188 144 116 74 320 55 Aden 266 (22.28) 26 211 299 305 39 Conclusions and Next Steps | 62
- 71. RANK PER SHIP SIZE RANGE Port Name Rank Index Points Total Calls 1,500 1,501- 5,000 5,001- 8,500 8,501- 13,500 13,500 2021 Change Rotterdam 267 (22.58) 2,096 236 216 159 129 63 291 24 Kingston (Jamaica) 268 (24.42) 828 223 275 138 125 131 -137 Mayotte 269 (25.10) 30 304 294 25 Alexandria (Egypt) 270 (27.34) 215 237 191 180 277 7 Monrovia 271 (28.29) 26 246 300 #N/A #N/A Lae 272 (28.70) 28 210 307 301 29 Mejillones 273 (28.78) 98 177 171 134 231 -42 Naples 274 (29.42) 139 49 203 162 139 283 9 Owendo 275 (30.89) 126 234 306 302 27 Melbourne 276 (31.45) 748 144 193 177 132 308 32 Sokhna 277 (34.32) 138 174 197 151 120 77 353 76 Otago Harbour 278 (34.79) 110 245 186 298 20 Adelaide 279 (35.40) 224 195 146 149 264 -15 Guayaquil 280 (36.20) 498 196 148 123 79 296 16 Iquique 281 (37.83) 136 175 238 100 161 319 38 Tanjung Priok 282 (39.19) 834 118 205 123 170 49 124 -158 Antofagasta 283 (39.65) 30 161 159 234 -49 Acajutla 284 (39.72) 43 270 294 271 -13 Tarragona 285 (40.44) 82 203 141 172 146 160 -125 Halifax 286 (42.58) 239 167 142 163 124 82 46 -240 Poti 287 (45.01) 69 243 315 226 -61 Brisbane 288 (45.42) 660 222 215 161 148 288 0 London 289 (45.86) 1,181 149 106 156 108 86 347 58 Iskenderun 290 (46.11) 204 227 131 205 77 70 -220 Port Elizabeth 291 (46.91) 75 281 190 312 21 Gdansk 292 (49.28) 318 235 171 12 92 203 -89 Seattle 293 (50.45) 152 214 160 153 69 336 43 Walvis Bay 294 (50.72) 104 297 183 117 328 34 Montreal 295 (52.54) 190 290 191 311 16 San Pedro (Cote D'ivoire) 296 (55.86) 54 322 318 22 Douala 297 (57.40) 189 261 316 340 43 Qasr Ahmed 298 (59.98) 56 225 323 282 -16 Constantza 299 (60.31) 262 195 231 164 272 -27 Port Reunion 300 (63.27) 242 179 269 174 150 333 33 Baltimore (USA) 301 (65.01) 358 91 156 173 131 84 76 -225 Valencia 302 (65.27) 810 239 267 179 110 78 135 -167 Port Botany 303 (66.12) 770 200 234 176 157 324 21 Onne 304 (70.19) 66 271 202 342 38 63 | Conclusions and Next Steps
- 72. RANK PER SHIP SIZE RANGE Port Name Rank Index Points Total Calls 1,500 1,501- 5,000 5,001- 8,500 8,501- 13,500 13,500 2021 Change Montevideo 305 (71.47) 531 58 249 152 104 89 284 -21 Cristobal 306 (72.38) 718 252 223 182 155 134 -172 Ashdod 307 (80.92) 469 190 288 155 145 81 329 22 Dunkirk 308 (81.08) 212 102 92 157 94 350 42 New York New Jersey 309 (82.87) 1,382 204 279 164 156 72 251 -58 Chattogram 310 (83.90) 212 273 325 341 31 Livorno 311 (87.26) 286 168 244 168 165 338 27 Tin Can Island 312 (92.78) 94 197 278 209 339 27 Fremantle 313 (95.23) 247 226 197 158 335 22 Lyttelton 314 (97.18) 216 266 302 200 314 0 Pointe-Noire 315 (101.50) 388 250 301 196 143 362 47 Dar Es Salaam 316 (103.26) 151 264 328 361 45 Freeport (Bahamas) 317 (105.05) 139 310 194 152 352 35 Beirut 318 (106.59) 382 162 181 178 114 93 357 39 Lome 319 (109.51) 175 298 215 349 30 Thessaloniki 320 (111.05) 177 257 287 212 331 11 Genoa 321 (111.41) 730 178 258 175 137 88 337 16 Napier 322 (114.79) 144 274 312 201 290 -32 Auckland 323 (115.66) 153 271 311 203 351 28 Tauranga 324 (118.93) 489 269 296 211 98 325 1 Mombasa 325 (119.08) 254 241 313 210 293 -32 Kribi Deep Sea Port 326 (120.92) 159 262 321 198 355 29 Tacoma 327 (122.69) 103 190 184 163 85 345 18 Hamburg 328 (126.65) 1,670 185 227 181 141 91 232 -96 Le Havre 329 (128.31) 853 188 251 187 136 90 292 -37 Port Louis 330 (142.19) 370 232 261 167 138 95 323 -7 Nouakchott 331 (142.77) 62 276 327 356 25 Cotonou 332 (146.42) 359 272 317 206 348 16 Manila 333 (150.75) 612 267 320 207 327 -6 La Spezia 334 (190.11) 159 228 309 166 140 97 313 -21 Abidjan 335 (200.23) 292 275 324 213 360 25 Rijeka 336 (218.88) 245 217 289 141 174 87 190 -146 Los Angeles 337 (252.55) 634 95 283 195 171 96 370 33 Houston 338 (253.08) 800 189 240 185 177 119 -219 Luanda 339 (268.05) 291 244 305 208 175 366 27 Ngqura 340 (272.15) 213 263 291 192 154 101 363 23 Charleston 341 (278.09) 1,161 150 274 193 167 100 130 -211 Trieste 342 (284.33) 353 247 268 199 166 99 326 -16 Conclusions and Next Steps | 64
- 73. RANK PER SHIP SIZE RANGE Port Name Rank Index Points Total Calls 1,500 1,501- 5,000 5,001- 8,500 8,501- 13,500 13,500 2021 Change Durban 343 (316.33) 389 260 318 216 173 364 21 Prince Rupert 344 (353.43) 90 330 218 151 344 0 Oakland 345 (365.00) 377 216 280 189 172 102 359 14 Koper 346 (371.36) 462 221 265 219 168 98 129 -217 Cape Town 347 (427.36) 185 319 220 176 365 18 Long Beach 348 (498.13) 282 242 329 204 160 103 369 21 Vancouver (Canada) 349 (593.37) 318 314 214 169 104 368 19 Savannah 350 (941.80) 1,115 258 326 217 178 105 367 17 Source: Original table produced for this publication, based on CPPI 2022 data. Table A.3. • The CPPI 2022 (the Statistical Approach) Port Name 2022 Rank Index Points 2021 Rank Change Yangshan 1 93.891159 3 2 Salalah 2 91.866199 2 0 Khalifa Port 3 88.783069 5 2 Tanger-Mediterranean 4 84.345303 6 2 Tanjung Pelepas 5 81.404458 16 11 Cartagena (Colombia) 6 80.7642 15 9 Hamad Port 7 80.579775 4 -3 Ningbo 8 80.349495 7 -1 Guangzhou 9 79.285176 9 0 Port Said 10 78.23557 13 3 Hong Kong 11 77.648186 38 27 Cai Mep 12 73.411131 11 -1 Algeciras 13 73.089835 10 -3 Mawan 14 72.78143 110 96 Shekou 15 72.422481 17 2 Tianjin 16 70.245532 26 10 Yokohama 17 70.033099 12 -5 Singapore 18 69.546328 31 13 King Abdullah Port 19 67.653064 1 -18 Posorja 20 65.563411 65 45 Buenaventura 21 65.480099 23 2 Busan 22 65.271824 25 3 Kaohsiung 23 62.883753 21 -2 65 | Conclusions and Next Steps
- 74. Port Name 2022 Rank Index Points 2021 Rank Change Chiwan 24 61.748811 20 -4 Yeosu 25 61.424749 29 4 Djibouti 26 61.219598 24 -2 Colombo 27 58.021452 22 -5 Laem Chabang 28 57.88501 48 20 Callao 29 52.181198 186 157 Jeddah 30 51.426625 8 -22 Pipavav 31 50.992508 34 3 Dammam 32 50.942405 14 -18 Barcelona 33 50.575247 19 -14 Xiamen 34 48.913154 40 6 Port Klang 35 46.897259 59 24 Coronel 36 46.714878 49 13 Jebel Ali 37 46.129933 42 5 Fuzhou 38 44.013292 96 58 Incheon 39 43.875315 53 14 Marsaxlokk 40 43.083907 74 34 Kobe 41 40.89719 37 -4 Dalian 42 40.540729 81 39 Yarimca 43 39.982902 30 -13 Nagoya 44 37.529667 43 -1 Wilmington (USA-N Carolina) 45 36.774971 #N/A #N/A Mundra 46 36.409572 46 0 Lazaro Cardenas 47 35.023765 109 62 Rio Grande (Brazil) 48 34.72914 91 43 Piraeus 49 34.516997 82 33 Shimizu 50 33.684835 45 -5 Haifa 51 33.68135 247 196 Jubail 52 33.535813 191 139 Tokyo 53 33.192474 51 -2 Altamira 54 32.481599 76 22 Port Of Virginia 55 32.125287 27 -28 Yantian 56 31.993295 270 214 Ambarli 57 31.934733 36 -21 Itapoa 58 31.914238 60 2 Zeebrugge 59 31.055198 291 232 Zhoushan 60 30.754019 228 168 Bremerhaven 61 29.912465 54 -7 Antwerp 62 29.273182 78 16 Da Chan Bay Terminal One 63 29.044824 122 59 Krishnapatnam 64 29.038774 87 23 Conclusions and Next Steps | 66
- 75. Port Name 2022 Rank Index Points 2021 Rank Change Sohar 65 28.832647 47 -18 Colon 66 28.737558 64 -2 Aqaba 67 28.660159 32 -35 Rio De Janeiro 68 26.736563 83 15 Kattupalli 69 25.480878 95 26 Boston (USA) 70 25.129463 115 45 Jawaharlal Nehru Port 71 24.52839 50 -21 Santa Cruz De Tenerife 72 24.384752 88 16 Keelung 73 24.140515 77 4 Savona-Vado 74 24.02082 111 37 Kamarajar 75 23.869578 71 -4 Khalifa Bin Salman 76 23.665701 61 -15 Paranagua 77 23.565968 166 89 Diliskelesi 78 23.313358 70 -8 Siam Seaport 79 23.124017 100 21 Osaka 80 22.970532 44 -36 Hazira 81 22.680683 69 -12 Jacksonville 82 22.603662 94 12 Puerto Limon 83 22.050489 80 -3 Karachi 84 21.867136 90 6 Port Everglades 85 21.459083 102 17 Shantou 86 21.28065 151 65 Muhammad Bin Qasim 87 20.424853 75 -12 Balboa 88 20.392186 55 -33 Johor 89 19.896225 79 -10 Cochin 90 19.844555 98 8 Aarhus 91 19.570453 67 -24 Lianyungang 92 19.231782 73 -19 Puerto Cortes 93 17.732475 141 48 Tanjung Perak 94 16.469817 103 9 Pointe-A-Pitre 95 16.4253 #N/A #N/A Fort-De-France 96 16.161755 127 31 Gemlik 97 16.092142 105 8 Veracruz 98 15.990696 85 -13 Nemrut Bay 99 15.746314 242 143 Ensenada 100 15.680764 86 -14 Paita 101 15.435808 84 -17 Malaga 102 15.414967 140 38 Penang 103 15.412607 116 13 New Orleans 104 14.640183 108 4 Philadelphia 105 14.521186 58 -47 67 | Conclusions and Next Steps
- 76. Port Name 2022 Rank Index Points 2021 Rank Change Mersin 106 14.482174 28 -78 Yokkaichi 107 14.088427 101 -6 Cat Lai 108 13.752034 132 24 Hakata 109 13.302854 117 8 Wilhelmshaven 110 13.23886 204 94 Limassol 111 13.039884 172 61 Naha 112 12.952755 126 14 Imbituba 113 11.977288 106 -7 Chennai 114 11.54741 92 -22 Gioia Tauro 115 10.935035 112 -3 Santos 116 10.133248 147 31 Danang 117 10.036422 156 39 Shuaiba 118 9.9966817 177 59 Saigon 119 9.9070327 125 6 Port Akdeniz 120 9.6068699 139 19 Puerto Barrios 121 9.4983004 196 75 Visakhapatnam 122 9.4912918 97 -25 Taichung 123 9.3591441 135 12 Salvador 124 8.8773066 130 6 San Juan 125 8.6750957 143 18 Noumea 126 8.5331801 93 -33 Izmir 127 8.4696178 246 119 Tanjung Emas 128 8.3960203 144 16 Qingdao 129 8.321523 33 -96 Sharjah 130 8.2674761 148 18 Santa Marta 131 7.9974024 137 6 Gothenburg 132 7.8368006 152 20 Shuwaikh 133 7.6920939 179 46 Omaezaki 134 7.6414656 120 -14 Vigo 135 7.4942362 138 3 Papeete 136 7.3557644 158 22 Moji 137 7.2633952 121 -16 Gijon 138 7.2546795 224 86 Batangas 139 7.1806229 #N/A #N/A Haiphong 140 7.0953581 63 -77 Puerto Quetzal 141 7.0730406 134 -7 Cebu 142 7.0085755 171 29 Berbera 143 6.9834428 165 22 Pecem 144 6.5441976 129 -15 Puerto Bolivar (Ecuador) 145 6.4609276 153 8 Quy Nhon 146 6.4548038 146 0 Conclusions and Next Steps | 68
- 77. Port Name 2022 Rank Index Points 2021 Rank Change Odessa 147 6.2193002 164 17 Caucedo 148 5.9831249 99 -49 Cadiz 149 5.7500438 217 68 Ancona 150 5.7374415 168 18 Cagayan De Oro 151 5.6934303 226 75 Fredericia 152 5.6819122 183 31 Chu Lai 153 5.6630756 216 63 Lirquen 154 5.4025422 118 -36 Ravenna 155 5.3971409 188 33 Port Tampa Bay 156 5.2737755 66 -90 Helsingborg 157 5.1685519 167 10 Rio Haina 158 4.9524185 155 -3 Casablanca 159 4.8162144 262 103 Umm Qasr 160 4.7689205 136 -24 Wellington 161 4.7374077 192 31 Nantes-St Nazaire 162 4.6900003 #N/A #N/A Borusan 163 4.6430391 149 -14 Vitoria 164 4.5940646 #N/A #N/A Gustavia 165 4.5843749 190 25 Barranquilla 166 4.5062808 163 -3 Bar 167 4.4550329 182 15 Puerto Progreso 168 4.2702304 205 37 Salerno 169 3.6117234 195 26 Sepetiba 170 3.434285 119 -51 Oslo 171 3.4049691 142 -29 Philipsburg 172 3.3186682 174 2 Leixoes 173 3.0744614 #N/A #N/A Latakia 174 3.0369427 173 -1 Larvik 175 2.8861643 206 31 Sines 176 2.879663 35 -141 Buenos Aires 177 2.5092931 124 -53 Muuga-Port Of Tallinn 178 2.391828 160 -18 Brest 179 2.3599453 #N/A #N/A Norrkoping 180 2.2969698 184 4 Conakry 181 2.2887926 239 58 Tema 182 2.2611246 353 171 Vila Do Conde 183 2.258435 245 62 London 184 2.170447 355 171 Suape 185 2.1573978 287 102 Civitavecchia 186 2.1010276 161 -25 Subic Bay 187 2.0266372 178 -9 69 | Conclusions and Next Steps
- 78. Port Name 2022 Rank Index Points 2021 Rank Change Valparaiso 188 1.934846 113 -75 Copenhagen 189 1.8552597 227 38 Bell Bay 190 1.8267218 211 21 Bluff 191 1.7454775 234 43 Rauma 192 1.6600785 210 18 Klaipeda 193 1.6402489 170 -23 Damietta 194 1.5382355 56 -138 Catania 195 1.4882068 193 -2 Burgas 196 1.4835229 197 1 Palermo 197 1.4631996 198 1 El Dekheila 198 1.4627075 133 -65 Bari 199 1.2712493 194 -5 Heraklion 200 1.2697978 212 12 Kristiansand 201 1.1905867 221 20 Nelson 202 1.0345817 189 -13 Tomakomai 203 1.0019976 237 34 Dakar 204 0.8774949 308 104 Apra Harbor 205 0.4193741 203 -2 Novorossiysk 206 0.3849053 159 -47 Rades 207 0.3390818 232 25 Mariel 208 0.3043624 219 11 Bilbao 209 0.2530552 201 -8 Matadi 210 0.2148891 176 -34 Caldera (Costa Rica) 211 0.1884466 264 53 La Guaira 212 0.1403443 263 51 Bordeaux 213 -0.168196 223 10 Trapani 214 -0.296926 209 -5 Shanghai 215 -0.402068 318 103 Belawan 216 -0.424559 238 22 Gdynia 217 -0.518666 225 8 Riga 218 -0.527474 207 -11 Lisbon 219 -0.59083 220 1 Marseille 220 -0.610633 297 77 Beira 221 -1.370338 268 47 Helsinki 222 -1.466602 169 -53 Point Lisas Ports 223 -1.478159 301 78 Kotka 224 -1.504547 231 7 Mogadiscio 225 -1.521115 254 29 Alicante 226 -1.684575 222 -4 Toamasina 227 -1.8707 280 53 Panjang 228 -2.111492 236 8 Conclusions and Next Steps | 70
- 79. Port Name 2022 Rank Index Points 2021 Rank Change Batumi 229 -2.145147 233 4 Miami 230 -2.662386 39 -191 Freetown 231 -2.765453 272 41 Nassau 232 -3.359467 208 -24 Tripoli (Lebanon) 233 -3.438159 89 -144 Teesport 234 -3.451123 250 16 Mobile 235 -3.60963 150 -85 Saint John 236 -3.8961 235 -1 Port Of Spain 237 -3.999666 252 15 Manaus 238 -4.190544 259 21 Hueneme 239 -4.777436 274 35 Itajai 240 -4.860375 #N/A #N/A Arica 241 -5.04979 295 54 Venice 242 -5.249944 230 -12 Bangkok 243 -5.307291 304 61 Varna 244 -5.32636 248 4 Maputo 245 -5.893511 323 78 San Antonio 246 -5.981112 320 74 Southampton 247 -6.017641 348 101 St Petersburg 248 -6.166687 #N/A #N/A Takoradi 249 -6.414522 290 41 Port Victoria 250 -6.470642 298 48 Gavle 251 -6.593461 256 5 Puerto Cabello 252 -7.384221 284 32 Agadir 253 -7.390557 260 7 Davao 254 -7.499438 279 25 Timaru 255 -7.522139 314 59 San Vicente 256 -7.880376 162 -94 Bejaia 257 -7.947162 289 32 Sokhna 258 -8.319628 352 94 Durres 259 -8.355378 319 60 Dublin 260 -8.49749 299 39 Lagos (Nigeria) 261 -8.503313 358 97 Aden 262 -8.547208 285 23 Corinto 263 -9.068531 283 20 Rotterdam 264 -9.558479 300 36 Kingston (Jamaica) 265 -10.03605 128 -137 Alexandria (Egypt) 266 -10.59644 266 0 Mayotte 267 -10.67549 293 26 Felixstowe 268 -10.97785 336 68 Seattle 269 -11.17249 322 53 71 | Conclusions and Next Steps
- 80. Port Name 2022 Rank Index Points 2021 Rank Change Naples 270 -12.15288 267 -3 Santo Tomas De Castilla 271 -12.40153 275 4 Iskenderun 272 -13.25392 72 -200 Melbourne 273 -13.25584 294 21 Mejillones 274 -13.26753 241 -33 Monrovia 275 -13.3903 #N/A #N/A Halifax 276 -13.76381 18 -258 Lae 277 -14.92325 306 29 Owendo 278 -15.07203 303 25 Otago Harbour 279 -15.55807 292 13 Adelaide 280 -16.17577 257 -23 Tanjung Priok 281 -16.48438 114 -167 Gdansk 282 -17.48768 199 -83 Brisbane 283 -17.58514 281 -2 Iquique 284 -17.89507 311 27 Ashdod 285 -18.07028 342 57 Guayaquil 286 -18.19975 302 16 Tarragona 287 -18.67975 157 -130 Antofagasta 288 -19.69405 273 -15 Montreal 289 -19.98314 313 24 Acajutla 290 -20.63371 269 -21 Port Elizabeth 291 -21.10723 317 26 Walvis Bay 292 -21.48845 332 40 Poti 293 -21.6105 213 -80 Constantza 294 -22.6387 261 -33 Port Botany 295 -24.63636 321 26 Manzanillo (Mexico) 296 -25.09643 52 -244 Port Reunion 297 -25.71414 #N/A #N/A Douala 298 -27.11337 340 42 Onne 299 -27.60095 343 44 San Pedro (Cote D'ivoire) 300 -27.883 315 15 Baltimore (USA) 301 -28.31127 #N/A #N/A Montevideo 302 -28.65839 265 -37 Valencia 303 -29.62095 180 -123 New York New Jersey 304 -30.6021 #N/A #N/A Tin Can Island 305 -31.18211 334 29 Chattogram 306 -32.49516 347 41 Qasr Ahmed 307 -32.62911 288 -19 Cristobal 308 -34.88104 185 -123 Tacoma 309 -36.76471 341 32 Fremantle 310 -38.76647 328 18 Conclusions and Next Steps | 72
- 81. Port Name 2022 Rank Index Points 2021 Rank Change Livorno 311 -39.35032 333 22 Dar Es Salaam 312 -42.56314 361 49 Genoa 313 -43.08853 335 22 Le Havre 314 -45.59272 286 -28 Lyttelton 315 -45.61401 312 -3 Lome 316 -45.74376 #N/A #N/A Pointe-Noire 317 -46.03578 362 45 Freeport (Bahamas) 318 -47.5856 351 33 Port Louis 319 -48.51084 329 10 Dunkirk 320 -51.82757 345 25 Thessaloniki 321 -53.02881 327 6 Napier 322 -54.03063 282 -40 Beirut 323 -54.84456 356 33 Kribi Deep Sea Port 324 -55.07653 357 33 Hamburg 325 -55.9153 258 -67 Auckland 326 -56.08951 350 24 Tauranga 327 -56.9159 330 3 Mombasa 328 -56.93792 296 -32 Manila 329 -64.58673 324 -5 Cotonou 330 -68.15778 346 16 Nouakchott 331 -70.48896 354 23 Abidjan 332 -84.62539 359 27 La Spezia 333 -88.35868 309 -24 Houston 334 -91.60496 123 -211 Rijeka 335 -95.62783 200 -135 Los Angeles 336 -98.4873 369 33 Luanda 337 -107.5817 366 29 Ngqura 338 -118.686 365 27 Durban 339 -123.8653 363 24 Trieste 340 -130.9884 338 -2 Charleston 341 -138.3375 187 -154 Prince Rupert 342 -145.9609 339 -3 Oakland 343 -154.6855 360 17 Cape Town 344 -164.2052 364 20 Koper 345 -196.1089 218 -127 Long Beach 346 -209.2063 370 24 Vancouver (Canada) 347 -224.4264 368 21 Savannah 348 -396.8871 367 19 Source: Original table produced for this publication, based on CPPI 2022 data 73 | Conclusions and Next Steps
- 82. Appendix B: Constructing the CPPI | 74 Appendix B: Constructing the CPPI The administrative and statistical approaches are explained in detail in this section. The Structure of the Data Before discussing the methodology employed in constructing the CPPI with matrix factorization, it is helpful to first summarize the structure of available data. The data set is segmented by the following five categories of ship sizes: • Feeders: 1,500 TEUs • Intra-regional: 1,500 TEUs –5,000 TEUs • Intermediate: 5,000 TEUs –8,500 TEUs • Neo-Panamax: 8,500 TEUs –13,500 TEUs • Ultra-large container carriers: 13,500 TEUs For each category, there are 10 different bands for call size. The port productivity is captured by average idle hour, which consists of two parts: port-to-berth (PB) and on-berth (B). In the previous CPPI iteration, total variables used = 5 x 10 x 2. Of course, many of them have missing values. The objective is to build a model to summarize these variables and then construct a port productivity index for all ports under consideration. The average waiting time and average berth time is calculated for each call size. The resulting data is a table/matrix whose rows represent ports and whose columns contain the average waiting and berth times of each call size.
- 83. Table B.1 • Sample Port Productivity Data Structure by Ship Size SHIP SIZE (K) CALL SIZE BAND (NUMBER OF MOVES) 250 251–500 …... 6,000 Ports Port-to- Berth Berth Total Port Hours Port-to- Berth Berth Total Port Hours Port-to- Berth Berth Total Port Hours 1 2 3 . . . Source: Original table produced for this publication 75 | Appendix B: Constructing the CPPI Imputation of Missing Values A major practical problem is that most idle hour variables have a significant number of missing values. For instance, in the port performance data set, the two smaller ship sizes contain little data for the larger call sizes. Consequently, as in the administrative approach, the call size groups with more than 2,000 moves were removed from the 1,500 TEU ship category, and the call size groups with more than 4,000 moves were removed from the 1,501 TEU–5,000 TEU ship category. A more sophisticated approach is to use likelihood-based methods to impute those missing values. For the current data set, expectation–maximization (EM) algorithm can be utilized to provide a maximum-likelihood estimator for each missing value. It relies on two critical assumptions. The first assumption is that gaps are random, or more specifically, the gaps are not caused by sample selection bias. The second assumption is that all variables under consideration follow a normal distribution. Given the data set, these two assumptions are plausible. EM computes the maximum likelihood estimator for the mean and variance of the normal distribution given the observed data. Knowing the distribution that generates the missing data, we can then sample from it to impute the missing values. Matrix factorization can then be performed on the resulting data set, instead of the original one filled with missing values. Missing values in the resulting table/matrix are reconstructed using the EM algorithm (Dempster, Laird, and Rubin 1977). A non-negativity constraint is added to make sure the reconstructed times are non- negative. Assuming the data has a multivariate Gaussian distribution with mean vector µ and covariance matrix ∑, the EM algorithm provides an estimate of the two parameters µ and ∑ via maximum likelihood. Missing values are imputed using their conditional expectation. In this approach, given a row with available values x_a and missing values x_m, the missing values are imputed by their conditional expectation E(x_m 1_(x_m )≥|x_a ) given the available data, where the expected value is computed only over the non-negative values of x_m to ensure the imputed values are non-negative. In this iteration, arrival and berth hours are aggregated into total port hours, just like in the administrative approach. The data structure after this aggregation for a particular category k (k = 1, 2, 3, 4, 5) can be summarized as shown in Table B.1.
- 84. Why Is Matrix Factorization Useful? Essentially, for each port, quite a few variables contain information about its efficiency. These include average time cost under various categories: (1) different call size bands, and (2) berth/port-to-berth. The reason matrix factorization can be helpful is that these variables are in fact determined by a small number of unobserved factors, which might include quality of infrastructure, expertise of staff, and so on. Depending on the data, very few of such factors can summarize almost all useful information. The challenge lies in the inability to observe those latent factors; however, a simple example could be helpful: Imagine three ports, each with four different types of time cost, as shown in table B.2. PORT COST 1 COST 2 COST 3 COST 4 A 1 2 3 4 B 2 4 6 8 C 3 6 9 12 Table B.2 • Sample Illustration of Latent Factors Source: Original table produced for this publication As one can observe, costs 2 to 4 are just some multiples of cost 1. Although we have four variables, to rank the efficiency of these three ports, just one variable is enough (ABC). This is an extreme case, but the idea can be generalized if these variables are somehow correlated, but to a less extreme extent. In that case, the factors are computed as some linear combination of costs 1 to 4. Of course, if costs 1 to 4 are completely independent of each other, then this method makes no sense. Fortunately, this is not the case for our data set. Thus, for each port, we can compute its score on all factors and then combine those scores together to reach a final efficiency score. Note that in the statistical approach using matrix factorization, the scores are not calculated for each call size range. On the contrary, the whole data set, including the smaller ports, is used simultaneously to obtain latent factors. This is in sharp contrast to the administrative approach. The statistical approach factors in all the correlations among hours for various call size bands, which purely from a statistical perspective is more efficient. There is no right or wrong methodology, but the two different approaches that are considered complementary. Hence, the decision in this iteration of the CPPI to maintain both approaches, to try and ensure that the resulting ranking(s) of container port performance reflects as closely as possible actual port performance, whilst also being statistically robust. The Statistical Methodology The data are scaled and weighted as in the administrative approach. • Let p_ij denote average port time of port i in call size j. • Let p_(avg,j ) denote the average of the average port time of all ports in the given call size. • Let w_j denote the ratio of port calls that are in the call size group j • The data are scaled by replacing p_ij by. Appendix B: Constructing the CPPI | 76
- 85. A positive value of x_(ij ) means the port is doing better than average, whereas a negative value means it is doing worse than average. Let X = (x_(ij )) denote the resulting matrix of scaled port time. Assume X has n rows (n ports) and p columns (p call size bands). Instead of using factor analysis as in the previous iteration, the matrix X is decomposed as X ≈ WH where W is a n×k matrix and H is an entrywise non-negative k ×p matrix. The integer k (the number of columns of W) is chosen to be a small number to compress the data. The matrix W represents factors and the matrix H factor loadings that are used to explain the data X. A number of k = 3 factors was found to be adequate to approximate the data matrix X. Note: In the previous iteration, a factor analysis (FA) approach was used. The FA produces a matrix factorization X ≈ WH as above, except that the matrix H does not need to be non-negative. This is a problem since a large positive factor does not necessarily represent a small port time if the corresponding loading is negative. The new approach fixes that problem by enforcing non-negativity in the loadings matrix H. This approach produces results that are consistent with the administrative approach. The CPPI for each ship size is obtained by adding the three columns of W. The CPPI index is a weighted sum of these indices: Let CPPIi denote the CPPI index for ship size i (i = 1, . . . ,5). where (α1 , α2 , α3 , α4 , α5 ) = (0.46, 1.00, 1.54, 1.97, 2.57) The Administrative Approach Aggregating arrival and berth hours into total port hours. This report indicated earlier that a case could be made for penalizing waiting time which is regarded as pure waste. However, as expressed earlier, this would be a normative judgment, accordingly both arrival and berth hours are weighted as 1.0 and the two time segments are summed to form total port hours in CPPI 2022. Appraising port hours performance. Average port hours are naturally higher in the larger than smaller call size groups. This can magnify the difference in hours between a subject port and the average port hours of the overall group. So, appraising on the difference between a port’s average hours and average hours of the group may skew the scoring unduly toward the larger call size calls. There are also far fewer calls within the larger than smaller call size groups, and this also needs to be reflected in the construction of the CPPI to retain maximum objectivity. The method applied to each call size group individually is that the port’s average port hours is compared with the group’s average port hours as a negative or positive quantity of hours. The result of that comparison is weighted by the ratio of port calls in each call size group for the entire group of ports Table B.3 provides an illustration as to how it is done. 77 | Appendix B: Constructing the CPPI
- 86. Table B.3 • Port Hours Performance Appraisal PORT PORT HOURS HOURS DIFFERENCE CALL SIZE GROUP WEIGHT RESULT Example Port 22.56 12.09 0.160 1.9344 Group Average 34.65 Source: Original table produced for this publication, based on CPPI 2021 data In this illustrative example, the subject port used 12.09 fewer hours than the average of the entire group (22.56 versus 34.65). Since 16.0 percent of all port calls in this ship size group were in the subject call size group, the difference in hours (12.09) is multiplied by ratio 0.160 for an overall index points result of 1.9344. Where a port uses more port time than the average for all ports, the index points become negative. Aggregation to a score and rank per ship size group. The “results” achieved per port within each of the 10 call size groups are then summed together to calculate a score within the overall ship size group (it is five and eight groups rather than 10 groups in the case of the two smaller ship size groups, respectively). Based upon these scores, there is a sub-ranking performed within each ship size group that can be reviewed in the final CPPI rankings. Aggregating all Ship Size Groups No allowance was made for ports that did not handle ships within specific ship size groups during the period under consideration. The primary reason is many of the smaller ports are not capable of handling some of the larger ship sizes and so would in effect be awarded positive (or negative) results for scenarios that are physically impossible. The omission of scores within some ship size groups would only be an issue if an attempt was made to compare the performance of major mainline ports with those of far smaller ports. But this is a comparison that is neither fair nor valuable. For the comparison between similarly sized ports, this factor will not contribute, or at least not significantly. In aggregating the scores from the various ship size groups into the overall CPPI in the administrative approach, a factor was built in to differentiate the importance and significance of better performance of larger ships over smaller ones. This was constructed based on the relative fuel consumption (and, therefore, emissions and cost) of different ship sizes in the form of an index (see table B.4). For each ship size group, a typical mid-range example ship was selected. Based upon the expected deployment of such ships, a range of sea legs were defined (and weighted), at a typical pro forma service speed, and the impact on fuel consumption that one hour longer (or shorter) in port would be likely to yield. Appendix B: Constructing the CPPI | 78
- 87. NOMINAL TEU CAPACITY RANGE EXPECTED DEPLOYMENT SEA LEG WEIGHT (PERCENT) INDEX WEIGHT Less than 1,500 TEUs Feeders Intra-regional Singapore–Surabaya Rotterdam–Dublin Kingston–Port-au-Prince Busan–Qingdao 25 25 25 25 0.46 1,500 to 5,000 TEUs Intra-regional Africa Latin America Oceania Transatlantic Shanghai¬–Manila Rotterdam–Genoa Algeciras–Tema Charleston–Santos Xiamen–Brisbane Felixstowe–New York 30 30 10 10 10 10 1.00 5,000 to 8,500 TEUs Africa Latin America Oceania Transatlantic Asia–Middle East Hong Kong–Tema Charleston–Santos Xiamen–Brisbane Felixstowe–New York Shanghai–Dubai 20 20 20 20 20 1.54 8,500 to 13,500 TEUs Transpacific Asia–Middle East Asia–Mediterranean Busan–Charleston (via Panama) Hong Kong–Los Angeles Shanghai–Dubai Singapore–Piraeus 25 25 25 25 1.97 Greater than 13,500 TEUs Asia–Mediterranean Asia–North Europe Transpacific Singapore–Piraeus Singapore–Rotterdam Hong Kong–Los Angeles 40 40 20 2.57 Table B.4 • Assumptions to Determine a Fuel Consumption Index Source: Original table produced for this publication, based on CPPI 2022 data The index weight then suggests that it is 2.57 times more costly to recover an additional hour of port time at sea for a ship with a capacity of more than 13,500 TEUs than it would be for a ship in the 1,500 TEU–5,000 TEU capacity range. The total aggregated index points per port within each ship size group are then weighted by this cost/environmental factor. The sum of the weighted index points for each port across all five ship size groups are then summed and the final CPPI ranking is based on those weighted values. The primary focus was micro-delays and it was assumed that these would be recovered on long-haul ocean legs, and not between coastal ports, which would be more costly. Through simulation, if the index values are tweaked up or down by up to 10 percent, the overall ranking is unaffected. If they are adjusted so that larger ship size groups have lower indices than smaller ones, it results in radical changes to the overall ranking. The resulting index for main and secondary ports using the administrative approach is presented in chapter 3 and appendix A. 79 | Appendix B: Constructing the CPPI
- 88. Notes 1 International Maritime Organization (IMO) Resolution MSC.74(69) Annex 3. 2 See the International Maritime Organization’s website on “International Convention for the Safety of Life at Sea (SOLAS), 1974,” (accessed March 2022), at https://www.imo.org/en/About/Conventions/ Pages/ International-Convention-for-the-Safety-of-Life-at-Sea-(SOLAS),-1974.aspx. 3 International Convention for the Safety of Life at Sea (SOLAS), under the revised SOLAS 1974 Chapter V (as amended)—Safety of Navigation, section 19.2.415, carriage requirements for shipborne navigational systems and equipment. 4 See ITU’s website on “Technical Characteristics for an Automatic Identification System Using Time Division Multiple Access in the VHF Maritime Mobile Frequency Band,” (accessed November 2021), at https://www.itu.int/dms_pubrec/itu-r/rec/m/R-REC-M.1371-5-201402-I!!PDF-E.pdf. 5 It may be a conventional land-based port or a stretch of water designated as an area for transferring cargo or passengers from ship to ship. 6 The precise approach to produce a robust data set is detailed in appendix B. 7 The actual equation is: (Group Average Port Hours/Example Port Hours) x Call Size Group Weight. References • Dempster, A. P., N. M. Laird, and D. B. Rubin. 1977. “Maximum Likelihood from Incomplete Data via the EM Algorithm.” Journal of the Royal Statistical Society: Series B (Methodological), 39 (1): 1–22. https://doi.org/10.1111/j.2517-6161.1977.tb01600.x. • IALA (International Association of Marine Aids to Navigation and Lighthouse Authorities). 2005. IALA Guideline 1050: The Management and Monitoring of AIS information. Edition 1.0. Saint Germain: IALA. https://www.iala-aism.org/product/management-and-monitoring-of-ais-information- 1050/?download=true. • IALA (International Association of Marine Aids to Navigation and Lighthouse Authorities). 2016. IALA Guideline 1082: An Overview of AIS. Edition 2.0. Saint Germain: IALA. 19. https://www.iala-aism. org/product/an-overview-of-ais-1082/?download=true. Notes and References | 80