Markets
Visualized: The 100 Largest U.S. Banks by Consolidated Assets
View the high-resolution version of this infographic.


The 100 Largest U.S. Banks by Consolidated Assets
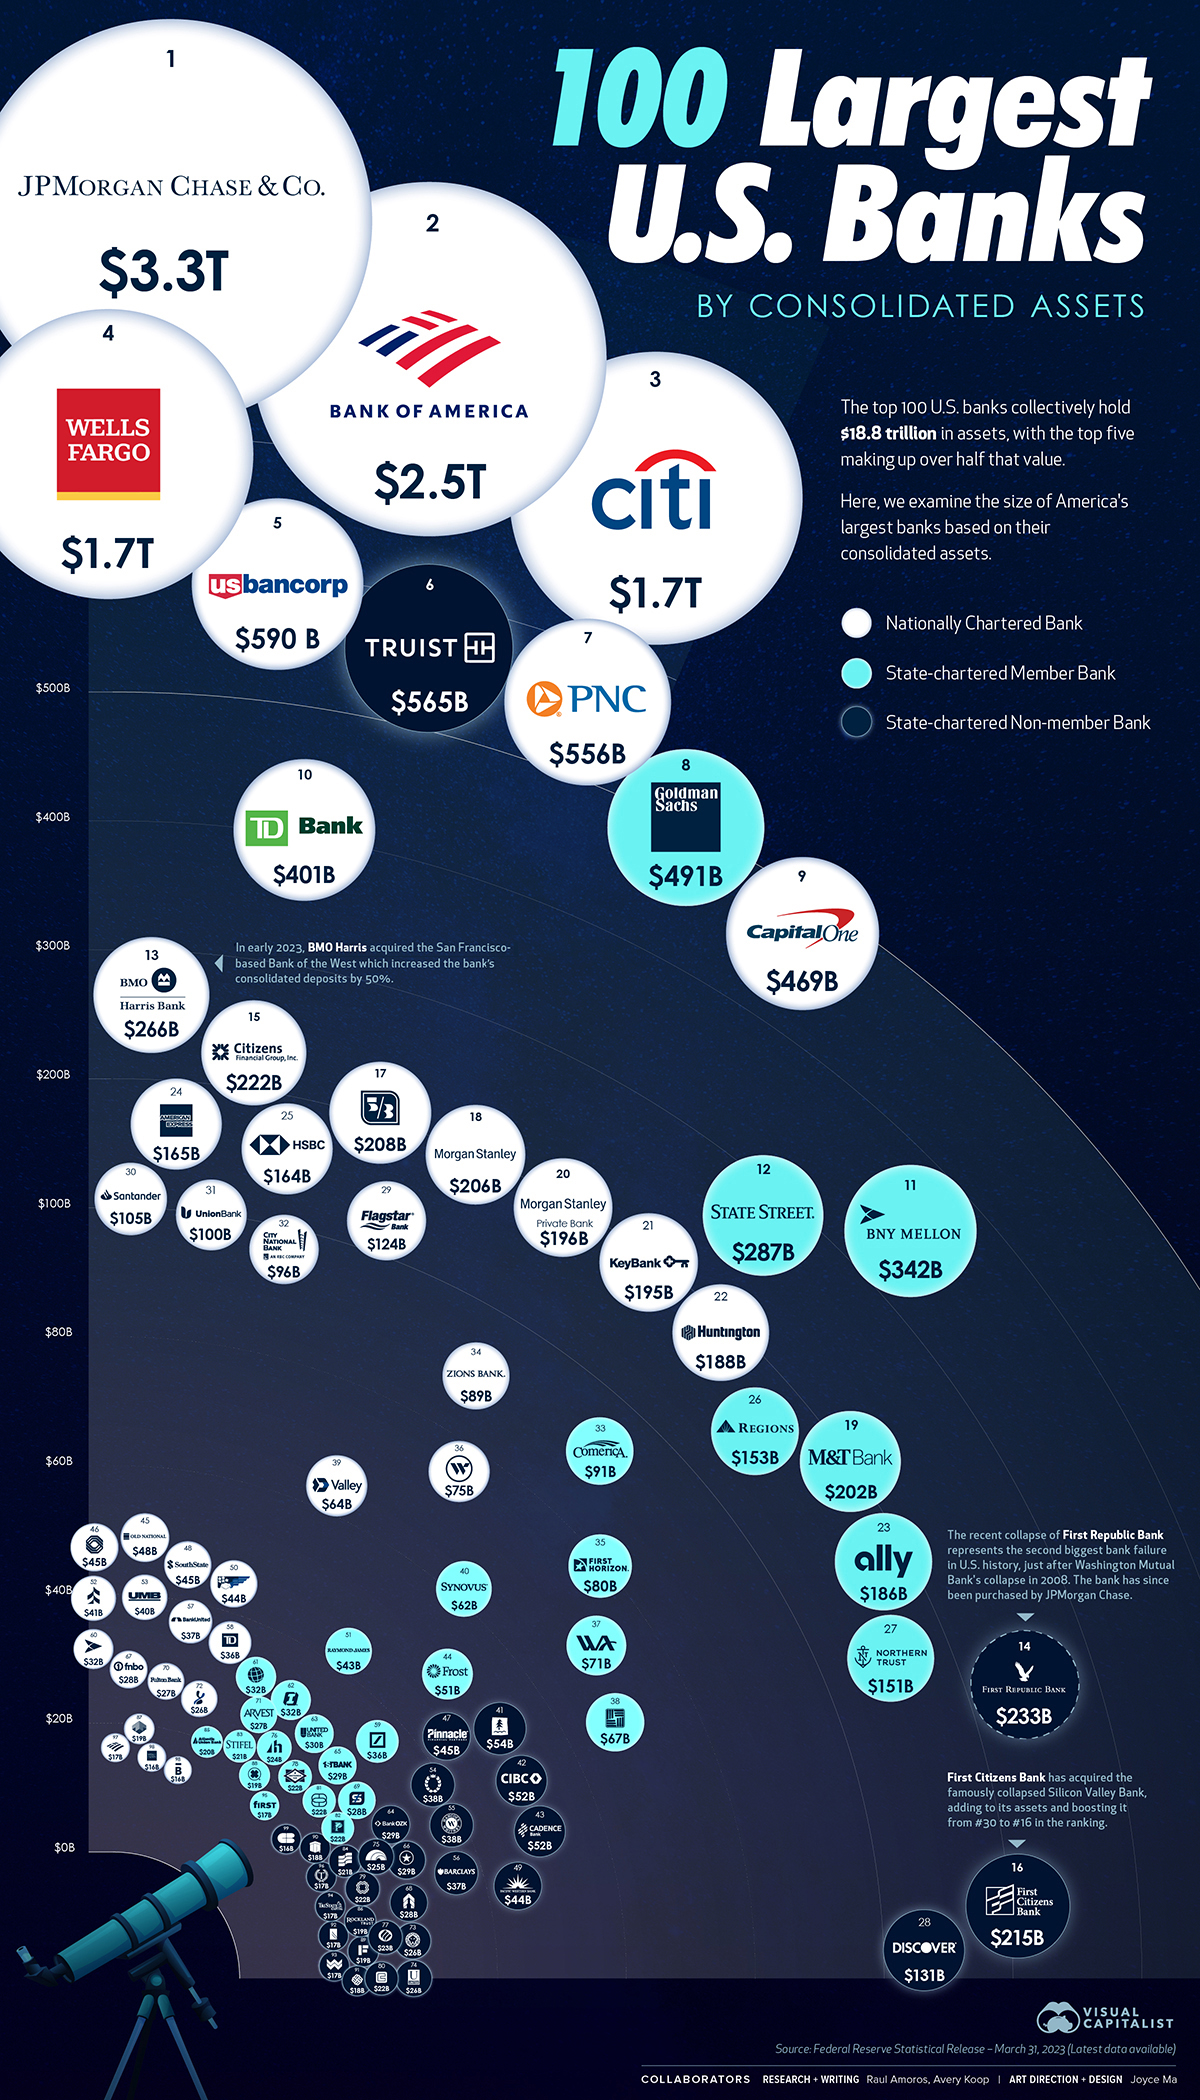
The largest 100 banks in the U.S. hold a combined $18.8 trillion in consolidated assets, but recent collapses of medium-sized banks like Silicon Valley Bank and First Republic have caused worries throughout the banking world.
This visual using data from the Federal Reserve ranks the country’s 100 largest banks by the size of their consolidated assets.
The Top 100 Banks
America’s biggest bank is JP Morgan Chase with over $3.3 trillion in assets, with Bank of America trailing behind in second place with $2.5 trillion. Here’s a closer look at the numbers:
| Rank | Bank / Holding Co Name | Consolidated Assets ($ Millions) |
|---|---|---|
| #1 | JP Morgan Chase Bank | $3,267,963 |
| #2 | Bank of America | $2,518,290 |
| #3 | Citibank | $1,721,547 |
| #4 | Wells Fargo | $1,687,507 |
| #5 | US Bancorp | $590,460 |
| #6 | Truist Bank | $564,837 |
| #7 | PNC Bank | $556,314 |
| #8 | Goldman Sachs | $490,799 |
| #9 | Capital One | $469,432 |
| #10 | TD Bank | $401,245 |
| #11 | Bank of NY Mellon | $341,455 |
| #12 | State Street | $287,069 |
| #13 | BMO Harris Bank | $265,446 |
| #14 | First Republic | $232,944 |
| #15 | Citizens Bank | $221,955 |
| #16 | First Citizens Bank | $214,599 |
| #17 | Fifth Third Bank | $207,586 |
| #18 | Morgan Stanely | $205,845 |
| #19 | Manufacturers and Traders Bank | $202,363 |
| #20 | Morgan Stanley Private Bank | $195,667 |
| #21 | Keybank | $195,191 |
| #22 | Huntington National Bank | $188,441 |
| #23 | Ally Bank | $186,383 |
| #24 | American Express | $165,450 |
| #25 | HSBC Bank USA | $164,492 |
| #26 | Regions Bank | $153,125 |
| #27 | Northern Trust | $150,573 |
| #28 | Discover Bank | $130,703 |
| #29 | Flagstar Bank | $123,633 |
| #30 | Santander Bank | $105,314 |
| #31 | MUFG Union Bank | $99,964 |
| #32 | City National Bank | $96,370 |
| #33 | Comerica Bank | $91,259 |
| #34 | Zions Bank | $88,574 |
| #35 | First Horizon Bank | $80,465 |
| #36 | Webster Bank | $74,793 |
| #37 | Western Alliance Bank | $70,986 |
| #38 | East West Bank | $67,219 |
| #39 | Valley National Bank | $64,314 |
| #40 | Synovus Bank | $61,726 |
| #41 | Umqua Bank | $53,986 |
| #42 | CIBC | $52,146 |
| #43 | Cadence Bank | $51,693 |
| #44 | Frost Bank | $51,286 |
| #45 | Old National Bank | $47,554 |
| #46 | BOK Financial | $45,269 |
| #47 | Pinnacle Bank | $44,988 |
| #48 | Southstate Bank | $44,903 |
| #49 | Pacific Western Bank | $44,255 |
| #50 | First National Bank of Pennsylvania | $44,132 |
| #51 | Raymond James Bank | $43,359 |
| #52 | Associated Bank | $40,653 |
| #53 | UMB Bank | $40,354 |
| #54 | Prosperity Bank | $37,829 |
| #55 | Hancock Whitney Bank | $37,525 |
| #56 | Barclays Bank | $37,352 |
| #57 | United Bank | $37,095 |
| #58 | TD Bank | $36,460 |
| #59 | Deutsche Bank | $36,103 |
| #60 | BNY Mellon | $31,945 |
| #61 | Commerce Bank | $31,853 |
| #62 | First Interest Bank | $31,565 |
| #63 | United Bank | $30,108 |
| #64 | Bank OZK | $28,971 |
| #65 | Firstbank | $28,764 |
| #66 | Texas Capital | $28,592 |
| #67 | First National Bank of Omaha | $28,393 |
| #68 | Glacier Bank | $27,785 |
| #69 | Simmons Bank | $27,538 |
| #70 | Fulton Bank | $26,996 |
| #71 | Arvest Bank | $26,946 |
| #72 | City National Bank of Florida | $26,204 |
| #73 | Ameris Bank | $25,991 |
| #74 | United Community Bank | $25,815 |
| #75 | First Hawaiian Bank | $24,883 |
| #76 | Bank of Hawaii | $23,904 |
| #77 | Eastern Bank | $22,702 |
| #78 | Centennial Bank | $22,452 |
| #79 | Washington Federal Bank | $22,320 |
| #80 | Cathay Bank | $22,016 |
| #81 | Customers Bank | $21,768 |
| #82 | Pacific Premier Bank | $21,362 |
| #83 | Stifel Banking and Lending | $20,969 |
| #84 | Bank of Hope | $20,564 |
| #85 | Atlantic Union Bank | $19,990 |
| #86 | Rockland Trust | $19,445 |
| #87 | Trustmark National Bank | $18,875 |
| #88 | Central Bancompany | $18,850 |
| #89 | DBA Independent Financial | $18,793 |
| #90 | First Merchants Bank | $18,165 |
| #91 | Mechanics Bank | $17,946 |
| #92 | Renasant Bank | $17,479 |
| #93 | Wesbanco | $17,237 |
| #94 | Tristate Capital Bank | $17,050 |
| #95 | First Financial Bank | $16,857 |
| #96 | Townebank | $16,730 |
| #97 | Bank of America | $16,550 |
| #98 | Wells Fargo | $16,473 |
| #99 | Citizens Bank | $16,271 |
| #100 | Bremer Bank | $15,763 |
The first and second place banks combined account for around 30% of the consolidated assets on this list. On the flip side, the smallest bank is Bremer Bank at $15.8 billion in consolidated assets. While this seems small in the context of this list, there are actually thousands of even smaller commercial financial institutions in the country.
Many banks have seen significant changes to their ranking since the last Fed data at the end of 2022. BMO Harris moved up 10 spots, going from $177 billion in consolidated assets to $265 billion—an increase of 50%. In February, the bank acquired the San Francisco-based Bank of the West (which previously ranked 34th on this list).
First Citizens also saw its rank improve, going from 30th to 16th, thanks to the acquisition of the remnants of Silicon Valley Bank.
In May 2023, a planned merger between First Horizon and TD Bank was mutually terminated. The merger, had it gone ahead, would have seen TD Bank surpass the size of Capital One.
Banking Heavyweights
Typically, big banks are less of a risk for borrowers in terms of their liquidity, holding huge sums in diversified assets, whereas smaller and more regional American banks have a narrower margin for error. However, many other factors beyond size play into risk, like an institution’s loan portfolio or management style.
Volatility in the banking sector is expected to have implications on the wider economy. For example, bank lending capacity is expected to decrease by 1% this year, a shift which the IMF expects will take almost half a percentage point off the U.S.’ overall GDP.
The largest banks have set aside billions in anticipation of bad loans as a result of pressure from rising interest rates. JP Morgan Chase currently has $2.3 billion in provisions/reserves built. Here’s a look at some of the current reserves that banks have set aside based on most recent data:
| Bank | Reserves Built / Reserves Released | As of |
|---|---|---|
| JP Morgan Chase | $2.3 billion | Q1 2023 |
| Wells Fargo | $1.2 billion | Q1 2023 |
| Goldman Sachs | $972 million | Q4 2022 |
| Citigroup | $241 million | Q1 2023 |
| Morgan Stanley | $234 million | Q1 2023 |
| Bank of America | $124 million | Q1 2023 |
Bank Volatility
Small and medium sized banks (<$250 billion in assets) play an important role in the economy. Collectively, these banks are responsible for 45% of consumer lending and 80% of commercial real estate lending.
However, lending by these banks has been tightening up, given the current economic conditions and fears around bank collapses.
Overall, continued turmoil in the banking sector would likely reduce profitability for banks and ultimately slow economic growth.


Markets
Mapped: Europe’s GDP Per Capita, by Country
Which European economies are richest on a GDP per capita basis? This map shows the results for 44 countries across the continent.


Mapped: Europe’s GDP Per Capita, by Country (2024)
This was originally posted on our Voronoi app. Download the app for free on iOS or Android and discover incredible data-driven charts from a variety of trusted sources.
Europe is home to some of the largest and most sophisticated economies in the world. But how do countries in the region compare with each other on a per capita productivity basis?
In this map, we show Europe’s GDP per capita levels across 44 nations in current U.S. dollars. Data for this visualization and article is sourced from the International Monetary Fund (IMF) via their DataMapper tool, updated April 2024.
Europe’s Richest and Poorest Nations, By GDP Per Capita
Luxembourg, Ireland, and Switzerland, lead the list of Europe’s richest nations by GDP per capita, all above $100,000.
| Rank | Country | GDP Per Capita (2024) |
|---|---|---|
| 1 | 🇱🇺 Luxembourg | $131,380 |
| 2 | 🇮🇪 Ireland | $106,060 |
| 3 | 🇨🇭 Switzerland | $105,670 |
| 4 | 🇳🇴 Norway | $94,660 |
| 5 | 🇮🇸 Iceland | $84,590 |
| 6 | 🇩🇰 Denmark | $68,900 |
| 7 | 🇳🇱 Netherlands | $63,750 |
| 8 | 🇸🇲 San Marino | $59,410 |
| 9 | 🇦🇹 Austria | $59,230 |
| 10 | 🇸🇪 Sweden | $58,530 |
| 11 | 🇧🇪 Belgium | $55,540 |
| 12 | 🇫🇮 Finland | $55,130 |
| 13 | 🇩🇪 Germany | $54,290 |
| 14 | 🇬🇧 UK | $51,070 |
| 15 | 🇫🇷 France | $47,360 |
| 16 | 🇦🇩 Andorra | $44,900 |
| 17 | 🇲🇹 Malta | $41,740 |
| 18 | 🇮🇹 Italy | $39,580 |
| 19 | 🇨🇾 Cyprus | $37,150 |
| 20 | 🇪🇸 Spain | $34,050 |
| 21 | 🇸🇮 Slovenia | $34,030 |
| 22 | 🇪🇪 Estonia | $31,850 |
| 23 | 🇨🇿 Czech Republic | $29,800 |
| 24 | 🇵🇹 Portugal | $28,970 |
| 25 | 🇱🇹 Lithuania | $28,410 |
| 26 | 🇸🇰 Slovakia | $25,930 |
| 27 | 🇱🇻 Latvia | $24,190 |
| 28 | 🇬🇷 Greece | $23,970 |
| 29 | 🇭🇺 Hungary | $23,320 |
| 30 | 🇵🇱 Poland | $23,010 |
| 31 | 🇭🇷 Croatia | $22,970 |
| 32 | 🇷🇴 Romania | $19,530 |
| 33 | 🇧🇬 Bulgaria | $16,940 |
| 34 | 🇷🇺 Russia | $14,390 |
| 35 | 🇹🇷 Türkiye | $12,760 |
| 36 | 🇲🇪 Montenegro | $12,650 |
| 37 | 🇷🇸 Serbia | $12,380 |
| 38 | 🇦🇱 Albania | $8,920 |
| 39 | 🇧🇦 Bosnia & Herzegovina | $8,420 |
| 40 | 🇲🇰 North Macedonia | $7,690 |
| 41 | 🇧🇾 Belarus | $7,560 |
| 42 | 🇲🇩 Moldova | $7,490 |
| 43 | 🇽🇰 Kosovo | $6,390 |
| 44 | 🇺🇦 Ukraine | $5,660 |
| N/A | 🇪🇺 EU Average | $44,200 |
Note: Figures are rounded.
Three Nordic countries (Norway, Iceland, Denmark) also place highly, between $70,000-90,000. Other Nordic peers, Sweden and Finland rank just outside the top 10, between $55,000-60,000.
Meanwhile, Europe’s biggest economies in absolute terms, Germany, UK, and France, rank closer to the middle of the top 20, with GDP per capitas around $50,000.
Finally, at the end of the scale, Eastern Europe as a whole tends to have much lower per capita GDPs. In that group, Ukraine ranks last, at $5,660.
A Closer Look at Ukraine
For a broader comparison, Ukraine’s per capita GDP is similar to Iran ($5,310), El Salvador ($5,540), and Guatemala ($5,680).
According to experts, Ukraine’s economy has historically underperformed to expectations. After the fall of the Berlin Wall, the economy contracted for five straight years. Its transition to a Western, liberalized economic structure was overshadowed by widespread corruption, a limited taxpool, and few revenue sources.
Politically, its transformation from authoritarian regime to civil democracy has proved difficult, especially when it comes to institution building.
Finally, after the 2022 invasion of the country, Ukraine’s GDP contracted by 30% in a single year—the largest loss since independence. Large scale emigration—to the tune of six million refugees—is also playing a role.
Despite these challenges, the country’s economic growth has somewhat stabilized while fighting continues.

-

 Markets5 days ago
Visualizing Global Inflation Forecasts (2024-2026)
-

 Green2 weeks ago
The Carbon Footprint of Major Travel Methods
-

 United States2 weeks ago
Visualizing the Most Common Pets in the U.S.
-

 Culture2 weeks ago
The World’s Top Media Franchises by All-Time Revenue
-

 voronoi1 week ago
Best Visualizations of April on the Voronoi App
-

 Wealth1 week ago
Charted: Which Country Has the Most Billionaires in 2024?
-

 Business1 week ago
The Top Private Equity Firms by Country
-

 Markets1 week ago
The Best U.S. Companies to Work for According to LinkedIn