

Energy Shift
Who Is Building Nuclear Reactors?
Who Is Building Nuclear Reactors?
Nuclear power is back in the spotlight as countries look to supplement renewable energy sources with a reliable and clean source of power.
The 2010s were a decade of decline for nuclear power in the wake of the Fukushima disaster in Japan. However, the recent push for clean energy is reviving the industry with several countries building new reactors, and others restarting or extending old ones.
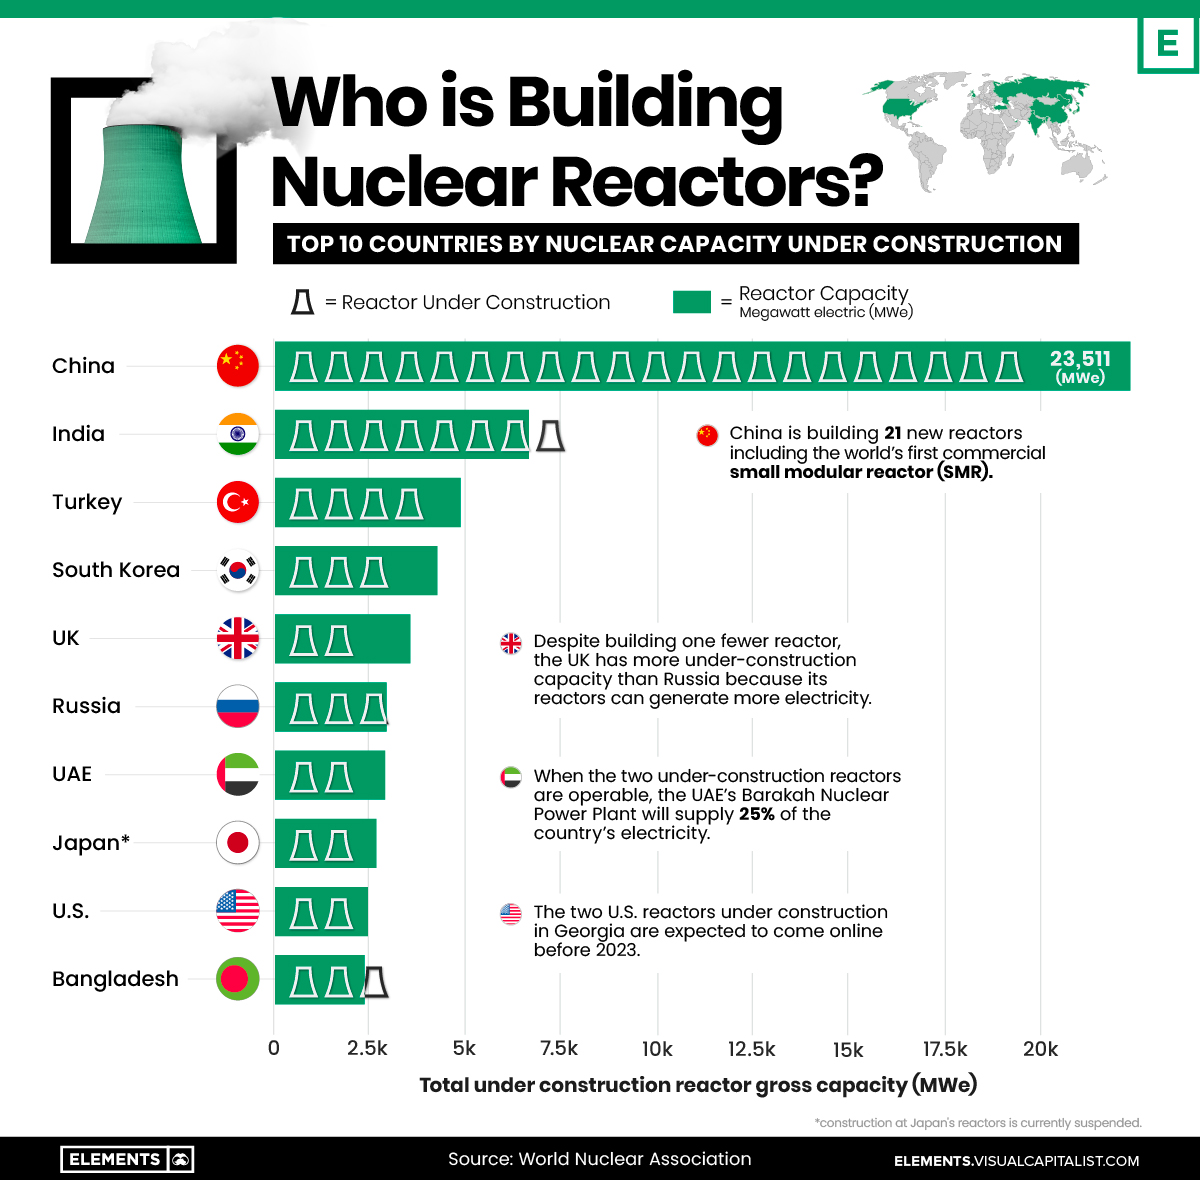
The above infographic uses data from the World Nuclear Association to show the top 10 countries by nuclear capacity under construction as of July 2022.
How Many Nuclear Reactors Are In the World?
Before looking at under-construction figures, it’s important to contextualize the current nuclear reactor landscape.
There are roughly 440 nuclear reactors operating worldwide, generating around 10% of the world’s electricity annually.
| Country | Number of operable reactors | Net capacity (MWe) |
|---|---|---|
| U.S. 🇺🇸 | 93 | 95,523 |
| France 🇫🇷 | 56 | 61,370 |
| China 🇨🇳 | 53 | 50,034 |
| Russia 🇷🇺 | 37 | 27,727 |
| Japan* 🇯🇵 | 33 | 31,679 |
| South Korea 🇰🇷 | 24 | 23,091 |
| India 🇮🇳 | 22 | 6,795 |
| Canada 🇨🇦 | 19 | 13,624 |
| Ukraine 🇺🇦 | 15 | 13,107 |
| UK 🇬🇧 | 12 | 7,343 |
*Only 10 of Japan’s 33 operable reactors are currently operating.
In the U.S., 93 reactors generate more than 30% of the world’s nuclear power, more than any other nation. In France, nuclear plants are the main source of power, accounting for 70% of annual electricity generation.
China’s nuclear industry has expanded rapidly over the last decade. The number of reactors in China jumped from 13 in 2010 to 53 in 2021, accompanied by a roughly five-fold increase in nuclear generation capacity.
India is an outlier—its generation capacity is lesser than the UK despite having 10 more operating reactors. This is largely because 17 of India’s 22 reactors have less than 300 MWe of capacity and are considered “small”.
Overall, around 280 of the world’s 440 reactors are over 30 years old. While these reactors are still performing at high capacity, new reactors are being built to support the aging fleet.
The Top 10 Countries Building New Reactors
The majority of new nuclear reactors are being built in Asia, with China topping the list followed by India.
| Country | Number of reactors under construction | Gross Capacity Under Construction, MWe |
|---|---|---|
| China 🇨🇳 | 21 | 23,511 |
| India 🇮🇳 | 8 | 6,600 |
| Turkey 🇹🇷 | 4 | 4,800 |
| South Korea 🇰🇷 | 3 | 4,200 |
| Russia 🇷🇺 | 3 | 2,810 |
| UK 🇬🇧 | 2 | 3,440 |
| UAE 🇦🇪 | 2 | 2,800 |
| Japan* 🇯🇵 | 2 | 2,653 |
| U.S. 🇺🇸 | 2 | 2,500 |
| Bangladesh 🇧🇩 | 2 | 2,400 |
| Ukraine* 🇺🇦 | 2 | 2,178 |
| Slovakia 🇸🇰 | 2 | 942 |
| France 🇫🇷 | 1 | 1,650 |
| Brazil* 🇧🇷 | 1 | 1,405 |
| Egypt 🇪🇬 | 1 | 1,200 |
| Belarus 🇧🇾 | 1 | 1,194 |
| Iran 🇮🇷 | 1 | 1,057 |
| Argentina 🇦🇷 | 1 | 29 |
| Total | 59 | 65,369 |
*Reactor construction is currently suspended in Japan, Ukraine, and Brazil.
China’s reliance on nuclear power is increasing as the economy transitions away from coal. With 21 reactors under construction, the country is set to expand its nuclear capacity by more than 40% before 2030. It’s also building the world’s first commercial small modular reactor (SMR), which will have the capacity to power more than 500,000 households annually.
Following China from afar is India, with eight reactors under construction that nearly double its generation capacity. While all reactors today are powered by uranium, India has an ambitious plan to develop a thorium-fueled reactor to reap its vast resources of thorium, a non-fissile radioactive material with the potential to be used as nuclear fuel.
Overall, the Asian continent (ex-Russia) accounts for 36 of the 59 reactors under construction. Meanwhile, Turkey is building four reactors including its first operational reactor, which is expected to come online in 2023.
As of July 2022, the largest under-construction reactors are in the UK with gross capacities of 1,720 MWe each. However, this may change as new constructions start with hundreds of reactors planned for construction across the globe.


Energy Shift
Visualizing Copper Production by Country in 2023
Chile and Peru account for one-third of the world’s copper output.

Visualizing Copper Production by Country in 2023
This was originally posted on our Voronoi app. Download the app for free on iOS or Android and discover incredible data-driven charts from a variety of trusted sources.
Copper is considered an essential metal for the clean energy transition because it is a great conductor of electricity.
As a result, governments around the world have been encouraging the construction of new mines, and mining companies have been seeking new projects and acquiring existing mines to meet the growing demand.
In this graphic, we illustrate global copper production in 2023, based on data from the U.S. Geological Survey, Mineral Commodity Summaries, as of January 2024.
Most Copper Comes from South America
Chile and Peru account for one-third of the world’s copper output.
| Country | Region | 2023E Production (Million tonnes) |
|---|---|---|
| 🇨🇱 Chile | South America | 5.0 |
| 🇵🇪 Peru | South America | 2.6 |
| 🇨🇩 Congo (Kinshasa) | Africa | 2.5 |
| 🇨🇳 China | Asia | 1.7 |
| 🇺🇸 United States | North America | 1.1 |
| 🇷🇺 Russia | Europe/Asia | 0.9 |
| 🇦🇺 Australia | Oceania | 0.8 |
| 🇮🇩 Indonesia | Asia | 0.8 |
| 🇿🇲 Zambia | Africa | 0.8 |
| 🇲🇽 Mexico | North America | 0.7 |
| 🇰🇿 Kazakhstan | Asia | 0.6 |
| 🇨🇦 Canada | North America | 0.5 |
| 🇵🇱 Poland | Europe | 0.4 |
| 🌍 Rest of World | -- | 3.1 |
| World total (rounded) | -- | 21.5 |
Chile is also home to the two largest mines in the world, Escondida and Collahuasi.
Meanwhile, African countries have rapidly increased their production. The Democratic Republic of Congo, for example, transitioned from being a secondary copper producer in the late 1990s to becoming the third-largest producer by 2023.
Part of the growth in copper mining in Africa is attributed to high investment from China. Chinese mining companies represent 8% of Africa’s total output in the mining sector.
Within its territory, China has also seen a 277% growth in copper production over the last three decades.
In the U.S., Arizona is the leading copper-producing state, accounting for approximately 70% of domestic output. Copper is also mined in Michigan, Missouri, Montana, Nevada, New Mexico, and Utah.
Energy Shift
Who’s Building the Most Solar Energy?
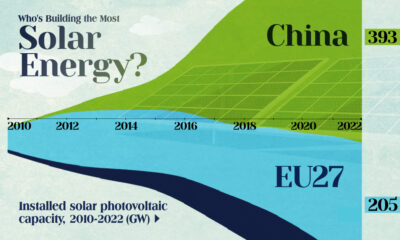
China’s solar capacity triples USA, nearly doubles EU.

Who’s Building the Most Solar Energy?
This was originally posted on our Voronoi app. Download the app for free on iOS or Android and discover incredible data-driven charts from a variety of trusted sources.
In 2023, solar energy accounted for three-quarters of renewable capacity additions worldwide. Most of this growth occurred in Asia, the EU, and the U.S., continuing a trend observed over the past decade.
In this graphic, we illustrate the rise in installed solar photovoltaic (PV) capacity in China, the EU, and the U.S. between 2010 and 2022, measured in gigawatts (GW). Bruegel compiled the data..
Chinese Dominance
As of 2022, China’s total installed capacity stands at 393 GW, nearly double that of the EU’s 205 GW and surpassing the USA’s total of 113 GW by more than threefold in absolute terms.
| Installed solar capacity (GW) | China | EU27 | U.S. |
|---|---|---|---|
| 2022 | 393.0 | 205.5 | 113.0 |
| 2021 | 307.0 | 162.7 | 95.4 |
| 2020 | 254.0 | 136.9 | 76.4 |
| 2019 | 205.0 | 120.1 | 61.6 |
| 2018 | 175.3 | 104.0 | 52.0 |
| 2017 | 130.8 | 96.2 | 43.8 |
| 2016 | 77.8 | 91.5 | 35.4 |
| 2015 | 43.6 | 87.7 | 24.2 |
| 2014 | 28.4 | 83.6 | 18.1 |
| 2013 | 17.8 | 79.7 | 13.3 |
| 2012 | 6.7 | 71.1 | 8.6 |
| 2011 | 3.1 | 53.3 | 5.6 |
| 2010 | 1.0 | 30.6 | 3.4 |
Since 2017, China has shown a compound annual growth rate (CAGR) of approximately 25% in installed PV capacity, while the USA has seen a CAGR of 21%, and the EU of 16%.
Additionally, China dominates the production of solar power components, currently controlling around 80% of the world’s solar panel supply chain.
In 2022, China’s solar industry employed 2.76 million individuals, with manufacturing roles representing approximately 1.8 million and the remaining 918,000 jobs in construction, installation, and operations and maintenance.
The EU industry employed 648,000 individuals, while the U.S. reached 264,000 jobs.
According to the IEA, China accounts for almost 60% of new renewable capacity expected to become operational globally by 2028.
Despite the phasing out of national subsidies in 2020 and 2021, deployment of solar PV in China is accelerating. The country is expected to reach its national 2030 target for wind and solar PV installations in 2024, six years ahead of schedule.

-

 Electrification3 years ago
Ranked: The Top 10 EV Battery Manufacturers
-

 Electrification2 years ago
The Key Minerals in an EV Battery
-

 Real Assets3 years ago
The World’s Top 10 Gold Mining Companies
-

 Electrification2 years ago
Mapped: Solar Power by Country in 2021
-

 Misc3 years ago
All the Metals We Mined in One Visualization
-

 Energy Shift2 years ago
What Are the Five Major Types of Renewable Energy?
-

 Electrification2 years ago
The World’s Largest Nickel Mining Companies
-

 Misc3 years ago
The Largest Copper Mines in the World by Capacity