Markets
Brand Reputations: Ranking the Best and Worst in 2023


Brand Reputations: Ranking the Best and Worst in 2023
A company’s reputation has become incredibly important in today’s world, where consumers, investors, and stakeholders are more discerning than ever.
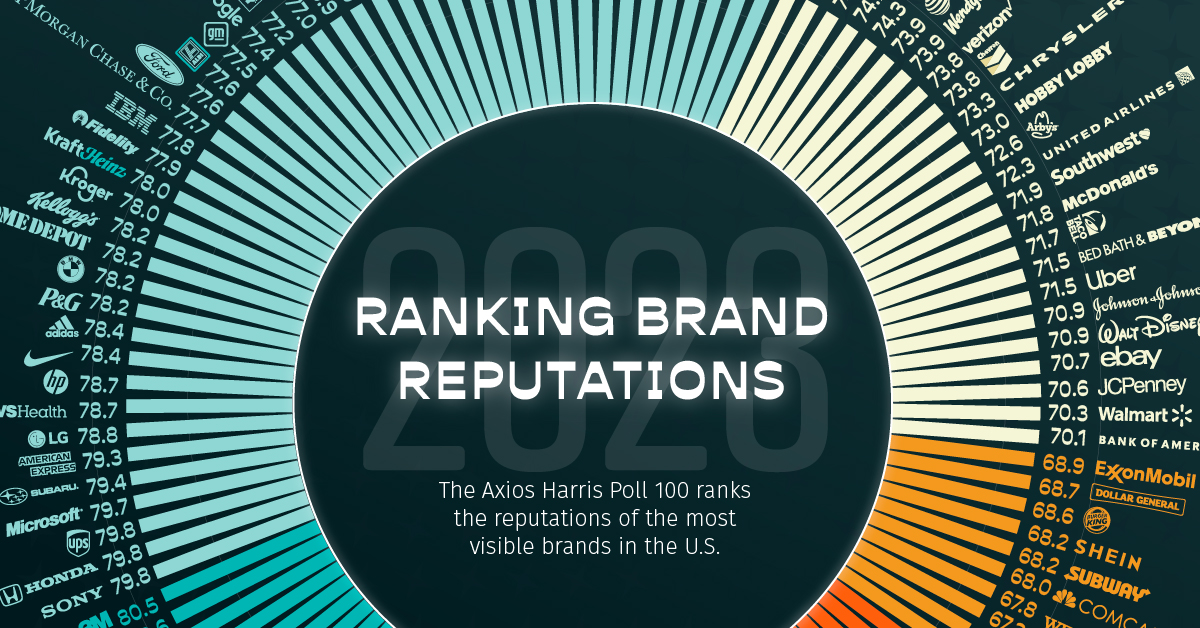
That’s why the Axios Harris Poll 100 has been measuring the reputations of the most visible companies in the United States for over two decades. In the graphic above, we’ve visualized the results for 2023, which are based on a survey of over 16,000 Americans from a nationally representative sample.
Data and Highlights
Each company’s score in the ranking is based on nine underlying categories. These are Character, Trajectory, Trust, Culture, Ethics, Citizenship, Vision, Growth, and Products & Services.
The top 10 of the Axios Harris Poll 100 come from a mix of industries including retail, technology, and automotive.
| 2023 Rank | Company | Score | Score Category | |
|---|---|---|---|---|
| #1 | Patagonia | 83.5 | Excellent | |
| #2 | Costco | 82.1 | Excellent | |
| #3 | John Deere | 82.0 | Excellent | |
| #4 | Trader Joe's | 81.7 | Excellent | |
| #5 | Chick-fil-A | 81.4 | Excellent | |
| #6 | Toyota | 81.0 | Excellent | |
| #7 | Samsung | 81.0 | Excellent | |
| #8 | Amazon | 80.7 | Excellent | |
| #9 | USAA | 80.6 | Excellent | |
| #10 | Apple | 80.6 | Excellent |
Patagonia takes the top spot overall, ranking first in the Character, Trajectory, Ethics, Citizenship, and Products & Services categories. The outdoor clothing brand has many social initiatives, including a self-imposed Earth tax that provides financial support to nonprofit environmental protection groups.
Costco is another highly ranked retailer, snagging first place in the Trust, Culture, and Growth categories. The company is famous for its unique warehouse-style stores, and is growing its international presence. As of June 2023, Costco had 854 locations in total, with 267 outside of the U.S.
If you’ve been keeping count, these two brands have claimed #1 in eight out of the nine underlying categories. The last category, Vision, goes to fast food restaurant chain Chick-fil-A.
In addition to its chicken sandwiches, Chick-fil-A is widely known for its corporate culture of care, where employees are treated more like family than just workers.
Biggest Reputation Drops
Brands that took the biggest reputational hits in 2023 were Taco Bell (-20), Netflix (-20), Target (-21), Chrysler (-22), and Tesla (-50).
Looking closer at Netflix, the company scores “excellent” in Products & Services, but only “good” in terms of Character and Citizenship. It’s possible that the company’s decision to crack down on password sharing may have negatively impacted its reputation.
Tesla took the biggest hit this year, and a closer look at its category scores reveals some interesting takeaways.
| Tesla - Reputation Score by Cateogry | ||
|---|---|---|
| Category | Score Classification | Score |
| Character | Fair | 69.3 |
| Trajectory | Excellent | 80.0 |
| Trust | Fair | 69.1 |
| Culture | Good | 70.5 |
| Ethics | Good | 71.3 |
| Citizenship | Fair | 68.1 |
| Vision | Excellent | 80.5 |
| Growth | Very Good | 78.8 |
| Products & Services | Excellent | 81.0 |
| Tesla - Total Score | Good | 74.3 |
With an “excellent” score in Products & Services, Vision, and Trajectory, it’s safe to assume that consumers still view Tesla as a pioneer in electric vehicles.
Where the firm has fallen, however, is in Character, Trust, and Citizenship, which may have something to do with public perception of CEO Elon Musk. The outspoken billionaire has become increasingly active on social media in recent years, and this may be rubbing some consumers the wrong way.
Tesla’s reputation may have also taken a hit after it announced significant price cuts in early 2023, which angered many recent buyers that had paid a higher price.


Markets
Mapped: Europe’s GDP Per Capita, by Country
Which European economies are richest on a GDP per capita basis? This map shows the results for 44 countries across the continent.


Mapped: Europe’s GDP Per Capita, by Country (2024)
This was originally posted on our Voronoi app. Download the app for free on iOS or Android and discover incredible data-driven charts from a variety of trusted sources.
Europe is home to some of the largest and most sophisticated economies in the world. But how do countries in the region compare with each other on a per capita productivity basis?
In this map, we show Europe’s GDP per capita levels across 44 nations in current U.S. dollars. Data for this visualization and article is sourced from the International Monetary Fund (IMF) via their DataMapper tool, updated April 2024.
Europe’s Richest and Poorest Nations, By GDP Per Capita
Luxembourg, Ireland, and Switzerland, lead the list of Europe’s richest nations by GDP per capita, all above $100,000.
| Rank | Country | GDP Per Capita (2024) |
|---|---|---|
| 1 | 🇱🇺 Luxembourg | $131,380 |
| 2 | 🇮🇪 Ireland | $106,060 |
| 3 | 🇨🇭 Switzerland | $105,670 |
| 4 | 🇳🇴 Norway | $94,660 |
| 5 | 🇮🇸 Iceland | $84,590 |
| 6 | 🇩🇰 Denmark | $68,900 |
| 7 | 🇳🇱 Netherlands | $63,750 |
| 8 | 🇸🇲 San Marino | $59,410 |
| 9 | 🇦🇹 Austria | $59,230 |
| 10 | 🇸🇪 Sweden | $58,530 |
| 11 | 🇧🇪 Belgium | $55,540 |
| 12 | 🇫🇮 Finland | $55,130 |
| 13 | 🇩🇪 Germany | $54,290 |
| 14 | 🇬🇧 UK | $51,070 |
| 15 | 🇫🇷 France | $47,360 |
| 16 | 🇦🇩 Andorra | $44,900 |
| 17 | 🇲🇹 Malta | $41,740 |
| 18 | 🇮🇹 Italy | $39,580 |
| 19 | 🇨🇾 Cyprus | $37,150 |
| 20 | 🇪🇸 Spain | $34,050 |
| 21 | 🇸🇮 Slovenia | $34,030 |
| 22 | 🇪🇪 Estonia | $31,850 |
| 23 | 🇨🇿 Czech Republic | $29,800 |
| 24 | 🇵🇹 Portugal | $28,970 |
| 25 | 🇱🇹 Lithuania | $28,410 |
| 26 | 🇸🇰 Slovakia | $25,930 |
| 27 | 🇱🇻 Latvia | $24,190 |
| 28 | 🇬🇷 Greece | $23,970 |
| 29 | 🇭🇺 Hungary | $23,320 |
| 30 | 🇵🇱 Poland | $23,010 |
| 31 | 🇭🇷 Croatia | $22,970 |
| 32 | 🇷🇴 Romania | $19,530 |
| 33 | 🇧🇬 Bulgaria | $16,940 |
| 34 | 🇷🇺 Russia | $14,390 |
| 35 | 🇹🇷 Türkiye | $12,760 |
| 36 | 🇲🇪 Montenegro | $12,650 |
| 37 | 🇷🇸 Serbia | $12,380 |
| 38 | 🇦🇱 Albania | $8,920 |
| 39 | 🇧🇦 Bosnia & Herzegovina | $8,420 |
| 40 | 🇲🇰 North Macedonia | $7,690 |
| 41 | 🇧🇾 Belarus | $7,560 |
| 42 | 🇲🇩 Moldova | $7,490 |
| 43 | 🇽🇰 Kosovo | $6,390 |
| 44 | 🇺🇦 Ukraine | $5,660 |
| N/A | 🇪🇺 EU Average | $44,200 |
Note: Figures are rounded.
Three Nordic countries (Norway, Iceland, Denmark) also place highly, between $70,000-90,000. Other Nordic peers, Sweden and Finland rank just outside the top 10, between $55,000-60,000.
Meanwhile, Europe’s biggest economies in absolute terms, Germany, UK, and France, rank closer to the middle of the top 20, with GDP per capitas around $50,000.
Finally, at the end of the scale, Eastern Europe as a whole tends to have much lower per capita GDPs. In that group, Ukraine ranks last, at $5,660.
A Closer Look at Ukraine
For a broader comparison, Ukraine’s per capita GDP is similar to Iran ($5,310), El Salvador ($5,540), and Guatemala ($5,680).
According to experts, Ukraine’s economy has historically underperformed to expectations. After the fall of the Berlin Wall, the economy contracted for five straight years. Its transition to a Western, liberalized economic structure was overshadowed by widespread corruption, a limited taxpool, and few revenue sources.
Politically, its transformation from authoritarian regime to civil democracy has proved difficult, especially when it comes to institution building.
Finally, after the 2022 invasion of the country, Ukraine’s GDP contracted by 30% in a single year—the largest loss since independence. Large scale emigration—to the tune of six million refugees—is also playing a role.
Despite these challenges, the country’s economic growth has somewhat stabilized while fighting continues.

-

 Markets5 days ago
Visualizing Global Inflation Forecasts (2024-2026)
-

 Green2 weeks ago
The Carbon Footprint of Major Travel Methods
-

 United States2 weeks ago
Visualizing the Most Common Pets in the U.S.
-

 Culture2 weeks ago
The World’s Top Media Franchises by All-Time Revenue
-

 voronoi1 week ago
Best Visualizations of April on the Voronoi App
-

 Wealth1 week ago
Charted: Which Country Has the Most Billionaires in 2024?
-

 Business1 week ago
The Top Private Equity Firms by Country
-

 Markets1 week ago
The Best U.S. Companies to Work for According to LinkedIn